
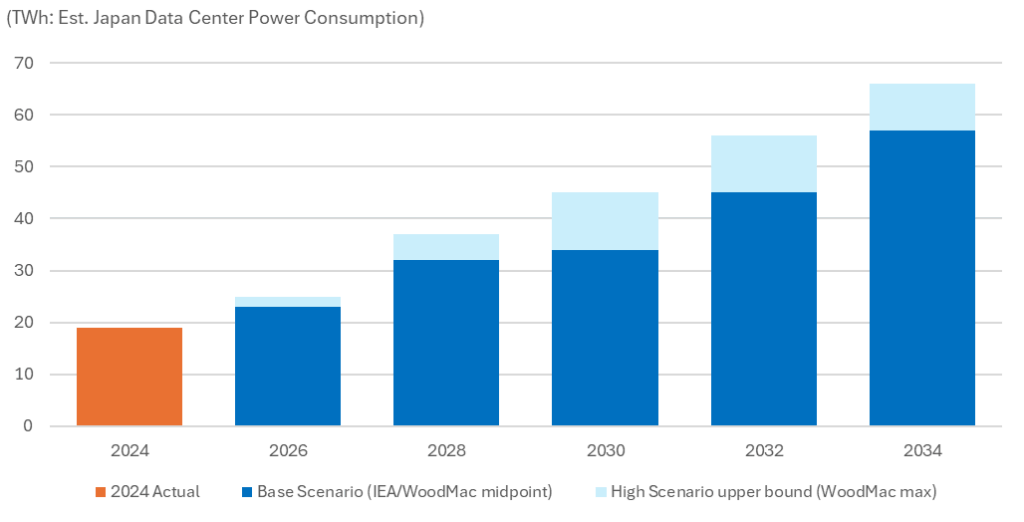
The rapid proliferation of AI is driving a dramatic surge in data center (DC) power consumption. Japan’s data center electricity demand is projected to more than triple from 19 TWh in 2024 to 57–66 TWh by 2034, accounting for 60% of Japan’s total electricity demand growth over that period.FN1
The IEA has noted that data centers will account for “more than half” of Japan’s incremental electricity demand.FN2 AWS has committed $15.2 billion by 2027, Microsoft $2.9 billion, and Oracle has been designated as an official government cloud provider — a massive wave of infrastructure investment is underway.FN3
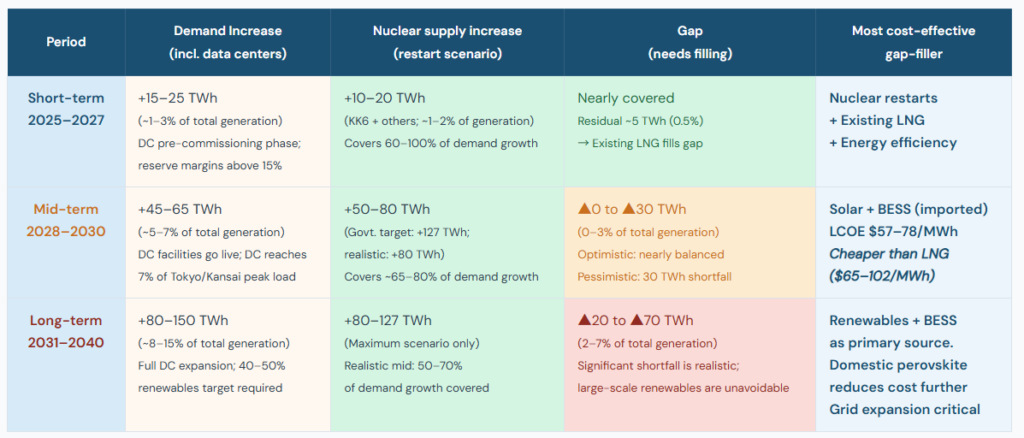
The timing of the surge is critical. In 2026–2027, data centers are still in construction and grid-connection stages; immediate power shortages are unlikely (reserve margins remain above 15%). The real crunch comes in 2028–2030, when facilities come online en masse — this is the maximum critical zone. From 2031–2040, demand expands to its full scale.FN1FN2
Japan Data Center Power Demand Growth Scenarios (TWh)
Source: Wood Mackenzie 2025 FN1, IEA Energy and AI 2025 FN2
Power Supply Options: Pros & Cons
The table below summarizes opportunities and risks across key power supply options.
| Options | Pros | Cons |
| Nuclear (Restarts) | Lowest LCOE ($30–45/MWh), 24-hr stable, zero-carbon | NRA review takes 1–5 yrs; local government consent required |
| Best near-to-mid-term tool to offset LNG price volatility | Government 20% target requires +11.4 GW of additional restarts | |
| Directly substitutes LNG demand | Realistic output increase: ~+80 TWh (government optimistic target: +127 TWh) | |
| – | Ageing fleet; decommissioning costs rising | |
| Nuclear (New build / SMR) | Long-term decarbonized baseload power source | 10–15 years to commissioning — too slow for near-term demand |
| Advanced reactors & SMRs expected to cut costs | Construction cost ¥100B–¥1T+ per unit; significant overrun risk | |
| Takaichi government has stated clear support | Nuclear waste final disposal remains unresolved | |
| Fossil fuels (LNG / coal) | LCOE $65-102/MWh | LNG import bill: ~¥6 trillion/yr ($41B in 2024) |
| Highly flexible; existing infrastructure readily available | Middle East tensions / Strait of Hormuz closure doubled JKM spot prices | |
| Essential short-term “bridge” source | LCOE $65–102/MWh — and volatile | |
| – | Contradicts carbon-neutral goals; stranded-asset risk post-2040 | |
| Renewables + BESS (Imported) | LCOE $57–78/MWh — cheapest dispatchable class alongside nuclear restarts | Grid infrastructure bottlenecks curtail utilization |
| Grid parity achieved | Large-scale ground-mounted solar faces environmental opposition | |
| Storage parity achieved | Dependency on Chinese supply chains — economic security risk | |
| Fastest to deploy; grid interconnection via interruptible connection | – | |
| Zero CO₂; AI-driven charge/discharge optimization stabilizes supply | – | |
| Renewables + BESS (Domestic) | Roof, factory & agrivoltaic deployment avoids land-clearing opposition | Does not build domestic industry |
| Low economic security risk; builds domestic industry & jobs | Grid & storage parity not yet achieved domestically | |
| Perovskite (Sekisui Chemical, etc.) and solid-state batteries (Toyota, etc.) are promising | No large-scale commercial BESS products available yet | |
| Energy efficiency / demand management | No additional generation needed; fastest & cheapest | AI demand growth is outpacing efficiency gains |
| AI chip & server efficiency gains naturally moderate demand growth | Cannot solve the power shortfall on its own | |
| Demand response (DR) shaves peak load | – |
Source: Wood Mackenzie 2025 FN1, ANRE 7th SEP FN4, BloombergNEF 2026 FN5, IEEFA 2024 FN10
How Much of Demand Can Nuclear Restarts Cover? — Gap Analysis
On 9 February 2026, TEPCO restarted Kashiwazaki-Kariwa Unit 6 (1,356 MW), bringing Japan’s operating reactor fleet to 15 units totaling 33 GW. This single unit is estimated to generate approximately 9.5 TWh/year — roughly 1% of Japan’s total generation.FN6 To meet the government’s 2030 target of 20% nuclear share, an additional 11.4 GW of restarts is required on top of the 12.6 GW operating at end-2024, bringing the required total to 24 GW.FN7
The reality, however, is sobering. The Renewable Energy Institute’s four-scenario analysis (March 2025) concludes that the government’s 20% target is achievable only under the extreme “Maximum” scenario. The realistic “Medium” scenario projects a nuclear share of approximately 12% — at 17 GW — by 2030.FN8 Thunder Said Energy’s tracker similarly estimates that a realistic scenario yields ~+80 TWh of additional output by 2030, well short of the government’s optimistic +127 TWh target — a gap of roughly 47 TWh.FN9
What Share of Demand Can Nuclear Restarts Cover? (By Time Horizon)
Source: US EIA 2026 FN6, EIA Japan 2024 FN7, Renewable Energy Institute 2025 FN8, Thunder Said Energy 2026 FN9, Wood Mackenzie 2025 FN1
Three key takeaways from this analysis:
① 2025–2027: Nuclear restarts + LNG can broadly cover demand — no major crisis expected.
② 2028–2030: As data centers come online, a gap emerges. Solar + BESS (imported) at $57–78/MWh is the cheapest gap-filler — cheaper than LNG ($65–102/MWh) and far cheaper than hydrogen ($150–200+/MWh).
③ 2031–2040: A large structural shortfall makes mass-scale renewables deployment unavoidable — the 2040 target (nuclear 20%, renewables 40–50%) cannot be met by nuclear alone.
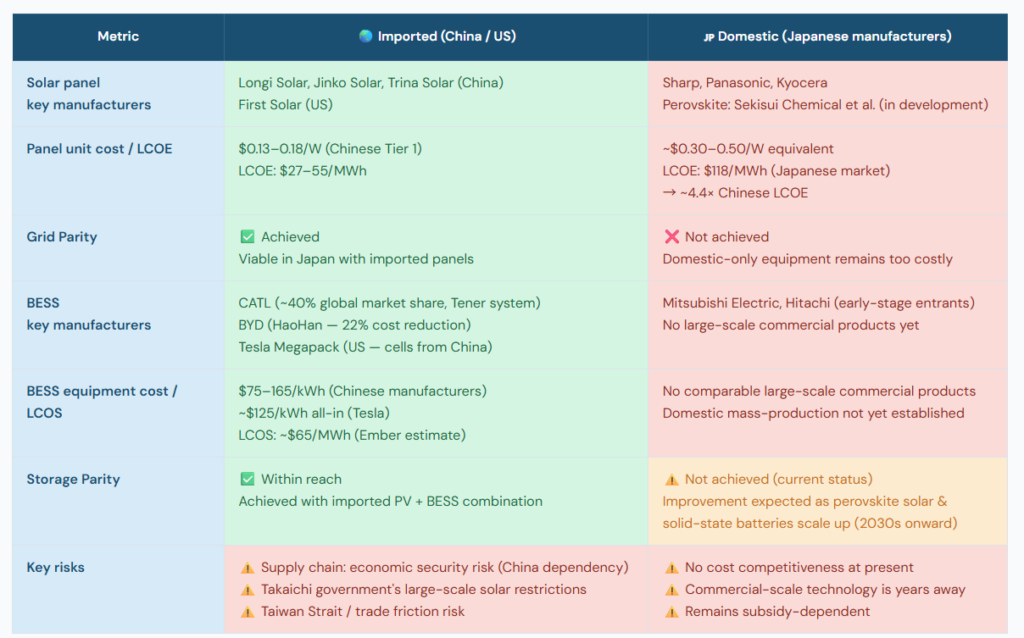
Grid Parity & Storage Parity: Imported vs. Domestic Equipment
In the long run, large‑scale deployment of renewables will be unavoidable — but achieving it requires crossing two key parity thresholds.
Grid Parity: The point at which a renewable energy source’s cost of generation equals or falls below the price of grid electricity from utilities. Solar and wind are intermittent — they generate when weather permits, not necessarily when demand is highest. Grid parity alone does not solve the “availability when needed” problem.
Storage Parity: The point at which the total cost of solar + battery storage falls below the cost of solar-only. Once this threshold is crossed, batteries become “essential, not optional” — and solar transforms from a daytime-only resource into a 24-hour dispatchable power source, resolving the intermittency problem.
Key reality: both thresholds are currently achievable only with imported equipment. Domestic equipment alone cannot yet reach either parity.
Domestic vs. Imported Equipment — Parity Achievement Comparison
Source: US EIA 2026 FN6, EIA Japan 2024 FN7, Renewable Energy Institute 2025 FN8, Thunder Said Energy 2026 FN9, Wood Mackenzie 2025 FN1
The root cause of this competitiveness gap is the investment scale disparity. China invested approximately ¥92 trillion ($625 billion) in clean energy in 2024 — 31% of the global total.FN13 Japan’s GX government advance investment totals ¥20 trillion over 10 years (~¥2 trillion/year), and even that is fragmented across hydrogen/ammonia, CCS, nuclear, and perovskite priorities — limiting the scale effects on any single technology.
LCOE Comparison by Power Source
With imported equipment, solar + BESS is already in the same cost tier as existing nuclear restarts — and far cheaper than hydrogen/ammonia.
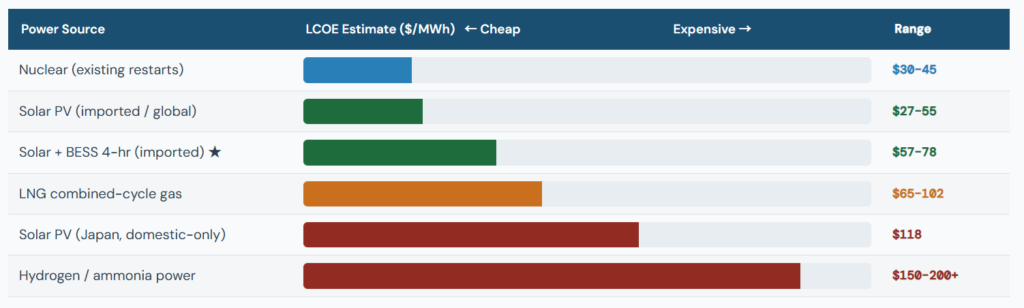
Source: BloombergNEF 2026 FN5, Wood Mackenzie 2025 FN1, ANRE generation cost estimates FN4
Japan’s 7th Strategic Energy Plan (Feb. 2025) projects that 50–90% of the remaining fossil fuel generation capacity in 2040 will be converted to CCS-equipped or hydrogen/ammonia co-firing plants.FN4 Yet these technologies sit at the top of the LCOE chart and remain commercially unproven at scale. ~90% of the cost of hydrogen is transportation (liquefaction, shipping) — and the 2024 collapse of Australia’s blue hydrogen project has made Japan’s 2030 cost target of ¥30/Nm³ increasingly difficult to reach.FN9 Investors and operators must price this risk carefully.
Energy Mix Scenarios & Fiscal Impact of Fossil Fuel Dependency
Energy policy choices have direct fiscal consequences. Japan’s fossil fuel import bill stood at approximately ¥22 trillion ($150B) in 2025 — LNG alone accounting for roughly ¥6 trillion ($41B).FN10 During the 2022 energy crisis, fossil fuel imports surged to ¥33.7 trillion, pushing the trade deficit to a record ¥20 trillion+. The government spent ¥13.4 trillion on energy subsidies over 2022–2025, and approved a further ¥5 trillion package in February 2026 following the Iran conflict (Strait of Hormuz disruption).FN10 Japan’s government debt stands at 235% of GDP — the highest among advanced economies — and these subsidies are compounding fiscal pressure.FN13
Four Energy Mix Scenarios: Power Composition and Fiscal Impact
A = Fossil-heavy (status quo extension) | B = Nuclear-led (government target) | C = Renewables-led (imported equipment focus) | D = Balanced (recommended)
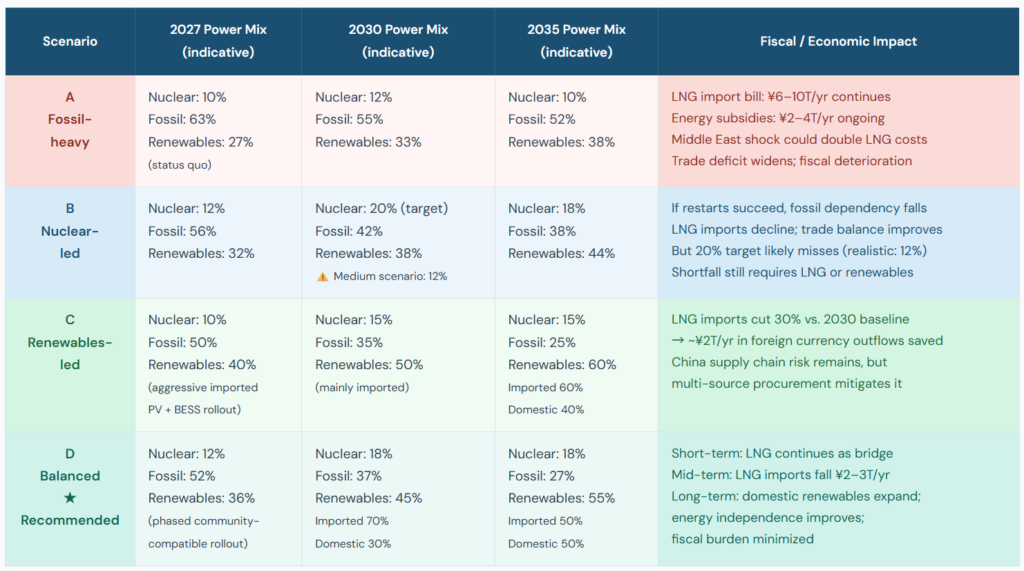
Note: Power mix figures are indicative estimates. Fiscal impact is a qualitative assessment. Source: IEEFA 2024/2026 FN10FN13, ANRE 7th SEP FN4, BloombergNEF 2026 FN5
Conclusion: Balancing Energy Diversification, Security & Cost Rationality
▶ Short-Term (Now–2027): Weather the Storm with Nuclear Restarts + Early Renewables
- Maximize energy efficiency — AI server efficiency gains and demand response (DR) partially offset demand growth. No additional generation needed; fastest and cheapest.
- Maximize existing nuclear restarts — Fast-track NRA-approved units. Cheapest 24/7 power; directly offsets LNG purchases and exposure to Middle East price spikes.
- Community-compatible solar + BESS (imported) as a leading wedge — Rooftop, factory, and agrivoltaic deployment avoids land-clearing disputes while achieving storage parity now.
- → This period precedes mass DC commissioning. Nuclear restarts can cover 60–100% of demand growth. No immediate crisis.
▶ Mid-Term (2028–2030): Fill the DC Power Gap with Solar + BESS — The Cheapest Option
- DC facilities go live at scale; a power gap of up to ▲30 TWh emerges that nuclear restarts alone cannot fill.
- The cheapest gap-filler is solar + BESS (imported) at LCOE $57–78/MWh — cheaper than LNG ($65–102/MWh) and far cheaper than hydrogen/ammonia ($150–200+/MWh).
- Accelerate grid infrastructure — reduce renewable interconnection costs to European levels; end solar curtailment.
- Diversify procurement sources (China, South Korea, ASEAN, US) to distribute economic security risk.
- → Imported renewables share targets: short-term ~70% → mid-term ~60% → long-term ~50%. Gradual transition toward domestic sourcing.
▶ Long-Term (2031–2040+): Build Domestic Technology Independence & Cut Structural Fossil Dependency
- Scale domestic perovskite solar cells (target: 20 GW by 2040) — roof & wall-surface installation, Japan’s key technology edge. Reduces China dependence.
- Commercialize solid-state batteries — Toyota and others have competitive positions; path to domestic BESS manufacturing.
- Start advanced reactor / SMR construction — decarbonized baseload power for the 2040s and beyond.
- Water/ammonia/CCS remain supplementary decarbonization tools — await technology maturation (currently the most expensive power sources).
- → As domestic renewables share grows, LNG imports could fall by ¥2–4 trillion/year, significantly reducing the trade deficit and energy subsidy burden.
▶ The Core Tension: Energy Diversification × Security × Cost Rationality
Japan’s energy challenge is uniquely difficult because three objectives are always in tension:
- Rely on Chinese equipment → Storage Parity is achievable, but economic security risks rise.
- Insist on domestic-only → costs are prohibitive; adoption stalls.
- Keep using LNG → Middle East geopolitical risk continues; fiscal hemorrhage from subsidies and import bills persists.
The answer lies in diversification and phased transition:
- Short-term: Nuclear restarts (cheapest, stable) + community-compatible imported solar + BESS → resolve the immediate power gap.
- Mid-term: Solar + BESS fills incremental demand at lowest cost. Gradually reduce LNG dependence to cut fiscal burden by ¥2–3T/year.
- Long-term: Domestic perovskite + solid-state batteries + next-gen nuclear → genuine energy independence.
Three potential approaches:
- ① Concentrate GX investment in near-term-impact renewables + BESS and grid infrastructure. Nuclear energy can serve as the primary power source for domestic hydrogen and ammonia production.
- ② Diversify procurement across multiple countries; achieve parity while managing single-source dependency risk.
- ③ Concentrate R&D investment in domestic perovskite solar and solid-state batteries — Japan’s path to long-term energy self-reliance.
Japanese translations
ストレージ・パリティが新たな基準に:AI主導の電力需要にどう対応するか(2030年代)
AI の急速な普及により、データセンター(DC)の電力消費は劇的に増加している。日本のデータセンター電力需要は、2024年の19 TWhから2034年には57〜66 TWhへと3倍以上に拡大し、同期間の国内電力需要増加の60%を占める見通しだ。FN1
IEA も、データセンターが日本の電力需要増加の「半分以上」を占めると指摘している。FN2 AWS は2027年までに152億ドル、Microsoft は29億ドルを投資し、Oracle は政府クラウドの公式プロバイダーに指定されるなど、大規模なインフラ投資が進行中である。FN3
Data Center Power Demand Growth Scenarios (TWh)
Source: Wood Mackenzie 2025 FN1, IEA Energy and AI 2025 FN2
この需要急増のタイミングが重要だ。2026〜2027年は建設・系統接続段階であり、予備率は15%以上を維持するため、即時的な電力不足は起きにくい。本格的な逼迫は、施設が一斉稼働する2028〜2030年に訪れる。この期間が最もクリティカルなゾーンである。2031〜2040年にかけて、需要はフルスケールへ拡大する。FN1FN2
電源オプション:メリットとリスク
以下は主要な電源オプションの機会とリスクを整理したもの。
原子力(再稼働)
Pros
- 最低水準の LCOE($30–45/MWh)、24時間安定、ゼロカーボン
- LNG価格変動を抑える最良の短中期手段
- LNG需要を直接代替
Cons
- NRA審査に1〜5年、自治体同意も必要
- 政府の20%目標には+11.4 GWの追加再稼働が必要
- 現実的な出力増は約+80 TWh(政府の+127 TWhは楽観的)
- 老朽化、廃炉コスト増大
原子力(新設・SMR)
Pros
- 長期的な脱炭素ベースロード
- 先進炉・SMRによりコスト低減期待
- 高市政権が明確に支持
Cons
- 稼働まで10〜15年、短期需要には間に合わない
- 建設費は1基あたり1,000億〜1兆円超、コスト超過リスク
- 最終処分問題は未解決
化石燃料(LNG・石炭)
Pros
- 柔軟性が高く、既存インフラが利用可能
- 短期的な「橋渡し」電源
Cons
- LNG輸入額は年間約6兆円
- 中東情勢悪化でJKMスポット価格が倍増
- LCOEは$65–102/MWhと高く変動
- 脱炭素目標と矛盾、2040年以降は座礁資産リスク
再エネ+蓄電池(輸入)
Pros
- LCOE $57–78/MWh:再稼働原発と並ぶ最安クラス
- グリッドパリティ・ストレージパリティ達成済み
- 最速で導入可能、遮断可能系統接続が利用可能
- ゼロCO₂、AI制御で安定化
- 屋根・工場・アグリPVで土地問題を回避
Cons
- 中国サプライチェーン依存
- 大規模地上設置は環境反対が強い
- 系統制約で出力抑制
- 国内産業育成にはつながらない
再エネ+蓄電池(国内)
Pros
- 経済安全保障リスクが低い
- 国内産業・雇用を創出
- ペロブスカイト・全固体電池に将来性
Cons
- パリティ未達
- 商用大規模BESSが未整備
- 量産化は5〜10年先
省エネ・需要管理
Pros
- 発電追加不要、最速・最安
- AIチップ・サーバー効率向上が需要増を緩和
- DRでピークを削減
Cons
- 需要増のペースが効率改善を上回る
- 単独では電力不足を解消できない
原子力再稼働はどこまで需要をカバーできるか(ギャップ分析)
2026年2月9日、柏崎刈羽6号機(1,356 MW)が再稼働し、稼働炉は15基・合計33 GWとなった。この1基だけで年間約9.5 TWhを発電し、日本の総発電量の約1%に相当する。FN6
2030年の政府目標(20%)を達成するには、2024年末時点の12.6 GWに加え、さらに11.4 GWの再稼働が必要である。FN7
しかし現実は厳しい。再エネ財団の分析(2025年3月)は、政府目標が達成可能なのは「最大」シナリオのみで、現実的な「中位」シナリオでは約12%(17 GW)にとどまるとする。FN8 Thunder Said Energy も、現実的な追加発電量は+80 TWh程度で、政府の+127 TWhとは約47 TWhのギャップがあると指摘する。FN9
What Share of Demand Can Nuclear Restarts Cover? (By Time Horizon)
Source: US EIA 2026 FN6, EIA Japan 2024 FN7, Renewable Energy Institute 2025 FN8, Thunder Said Energy 2026 FN9, Wood Mackenzie 2025 FN1
3つの主要ポイント
- 2025–2027:原発再稼働+LNGで需要増をほぼカバー。危機は起きない。
- 2028–2030:DC稼働でギャップ発生。最安のギャップフィラーは「輸入ソーラー+BESS」。
- 2031–2040:構造的な不足が顕在化。大規模再エネ導入は不可避。
グリッドパリティとストレージパリティ:輸入 vs 国内
長期的には再エネの大規模導入は避けられない。しかし、そのためには 2つのパリティ(Grid Parity / Storage Parity) を達成する必要がある。
- Grid Parity:再エネの発電コストが系統電力価格以下になる点
- Storage Parity:太陽光+蓄電池の総コストが太陽光単体を下回る点
現状、これらは 輸入機器でのみ達成可能。国内機器だけではまだ到達していない。
Domestic vs. Imported Equipment — Parity Achievement Comparison
Source: US EIA 2026 FN6, EIA Japan 2024 FN7, Renewable Energy Institute 2025 FN8, Thunder Said Energy 2026 FN9, Wood Mackenzie 2025 FN1
エネルギーミックスと財政影響
日本の化石燃料輸入額は2025年に約22兆円。2022年には33.7兆円に達し、貿易赤字は過去最大の20兆円超となった。 2022〜2025年のエネルギー補助金は13.4兆円、2026年2月にはイラン情勢を受けて追加で5兆円が承認された。FN10
政府債務はGDP比235%で先進国最高水準。補助金は財政負担を悪化させている。
LCOE Comparison by Power Source
With imported equipment, solar + BESS is already in the same cost tier as existing nuclear restarts — and far cheaper than hydrogen/ammonia.
Source: BloombergNEF 2026 FN5, Wood Mackenzie 2025 FN1, ANRE generation cost estimates FN4
結論:多角化 × 安全保障 × コスト合理性のバランス
短期(〜2027)
- 省エネ最大化
- 原発再稼働を加速
- コミュニティ適合型の輸入ソーラー+BESSを導入 → DC本格稼働前であり、危機は回避可能。
中期(2028–2030)
- 最大30 TWhのギャップが発生
- 最安のギャップフィラーは「輸入ソーラー+BESS」
- 系統増強と調達多角化が必須
長期(2031–2040)
- 国内ペロブスカイト・全固体電池の量産化
- 次世代原子炉・SMRの建設開始
- LNG依存を2〜4兆円/年削減可能
3つの戦略的アプローチ
- GX投資を再エネ+BESSと系統に集中
- 国内の水素・アンモニア製造には原子力発電を活用する。
- 調達先の多角化でパリティ達成と安全保障を両立
- 国内ペロブスカイト・全固体電池へのR&D集中
Four Energy Mix Scenarios: Power Composition and Fiscal Impact
A = Fossil-heavy (status quo extension) | B = Nuclear-led (government target) | C = Renewables-led (imported equipment focus) | D = Balanced (recommended)
Note: Power mix figures are indicative estimates. Fiscal impact is a qualitative assessment. Source: IEEFA 2024/2026 FN10FN13, ANRE 7th SEP FN4, BloombergNEF 2026 FN5