



Photo by Joshua Woroniecki on Unsplash. This article includes AI‑generated content. It does not constitute investment advice, nor does it imply any forecast or recommendation. All decisions should be based on independently verified data and the reader’s own judgment and professional expertise.
Begin with a category error that shapes most coverage of rare earths. The seventeen elements are not, in any meaningful geological sense, rare. They are dispersed. The constraint that matters is not abundance in the crust but the difficulty of separating chemically near-identical metals and converting them into a finished alloy, and above all the demand that pulls them through that gauntlet in the first place. Reserves are a stock. The story is a flow.
So this note inverts the usual telescope. Rather than ask which country holds leverage, it asks a more tractable and ultimately more revealing question: which technologies need which elements, in what quantity, and on what growth curve. The geography follows from the answer rather than preceding it.
I · What the elements actually do
Rare earths matter because a small number of them do jobs that no abundant substitute does as well. Crucially, those jobs are not the same job. The popular image of a single magic metal collapses several distinct physical functions into one, and the distinctions are where the supply risk concentrates.
The first function is magnetism. Neodymium, alloyed as Nd2Fe14B, delivers the highest energy product of any commercial permanent magnet, which is why it sits inside almost every efficient electric motor and direct-drive generator on the market.1 Praseodymium substitutes for part of the neodymium and stabilizes the alloy. The second function is heat tolerance, and here is the subtlety that drives the heavy rare earth premium. A plain neodymium magnet begins to surrender its coercivity well before the roughly 160°C an electric traction motor reaches in service, because the Curie temperature of the base phase is only around 312°C. Substituting a few percent of dysprosium or terbium into the grain boundaries raises both the anisotropy field and the effective Curie temperature, letting the magnet hold its strength under thermal stress.2 Dysprosium and terbium are therefore not bulk inputs; they are performance insurance, added in small amounts to solve a problem of degree, and they are the scarcest and most politically exposed links in the chain.
Where temperatures run higher still, a different chemistry takes over. Samarium-cobalt magnets carry a higher Curie temperature than neodymium and hold their magnetization in the heat without any dysprosium at all, at the cost of lower raw strength. That trade explains their concentration in aerospace generators, missile actuators and other places where thermal margin beats power density.3
The remaining functions have nothing to do with magnets. Gadolinium has the largest thermal-neutron capture cross-section of any natural element; the isotope Gd-157 alone absorbs neutrons at around 254,000 barns, which is why gadolinia is the standard burnable poison dosed into reactor fuel to flatten reactivity across a fuel cycle, with samarium and erbium serving in related roles.4 Europium, terbium and yttrium are luminescent: they are the red, green and host phosphors behind displays and solid-state lighting. Erbium and ytterbium are optical, doping the fiber amplifiers and lasers that carry and cut. Lanthanum and cerium are catalytic and abrasive, the workhorses of refining catalysts, exhaust treatment and semiconductor polishing. One basket, many unrelated jobs.
A neodymium magnet is a bulk commodity. A few percent of terbium inside it is a strategic chokepoint. The same ore stream contains both, and that asymmetry is the whole problem.
Figure 1 Which element does which job
Role of each rare earth in eight clean-technology applications. Larger, darker dots denote a more central role.
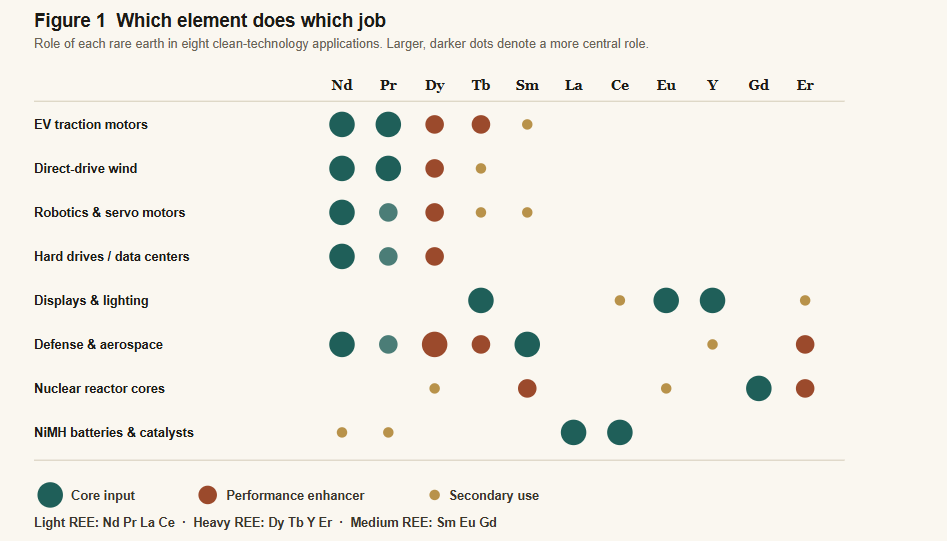
Notes: This chart includes AI‑generated elements and schematic redrawing for illustrative purposes. The chart was created as of June 16, 2026. All quantitative and qualitative references should be verified against the original source data. FIGURE 1. Permanent-magnet applications (rows 1 to 4 and 6) cluster on the neodymium-praseodymium core plus dysprosium and terbium for heat. Optical and phosphor uses sit on europium, terbium and yttrium. Reactor cores draw on gadolinium and samarium for neutron capture, not magnetism. Source: S1:DR synthesis of IEA and materials literature.1
II · Where the tonnes go, and how fast
With the functions mapped, the demand follows. Today the dominant pull is the permanent magnet, which already accounts for roughly 31 percent of rare earth demand by value, the single largest slice, and the fastest growing.5 The arithmetic is simple and unforgiving. A battery-electric vehicle carries on the order of 1.5 kilograms of neodymium-iron-boron in its drive unit, and around 95 percent of EV platforms now use such motors. With the global EV fleet on course to pass 300 million vehicles by 2030, the per-car figure scales into a structural demand wedge.6
Wind is smaller in unit count but heavier per unit. A direct-drive offshore generator uses on the order of 200 to 600 kilograms of high-performance magnet per megawatt, and offshore capacity is projected to climb from roughly 64 gigawatts in 2022 toward 380 gigawatts by 2030.7 Robotics, industrial servo drives and the spinning disks still archiving most of the world’s data add further magnet demand that rarely makes headlines. The IEA’s central case has magnet rare earth demand rising about 30 percent by 2030, with the EV share of that demand roughly doubling from 9 to 18 percent.8
Defense is small in volume but acute in consequence. A single F-35 embeds around 418 kilograms of rare earth material; an Arleigh Burke destroyer about 2,600 kilograms; a Virginia-class submarine roughly 4,600. The United States military alone consumes some 3,000 to 4,000 tonnes of specialized magnets a year, a figure its own agencies project could reach 10,000 tonnes by 2030.9 Nuclear adds a quieter claim: every gadolinia-bearing fuel assembly is a small, recurring draw on the medium and heavy fraction.
Figure 2 sizes the end markets that translate these intensities into orders. The point is less the absolute revenue than the slope. The magnet-bearing technologies are not merely large; they are compounding at high single to double-digit rates while the supply of the scarcest inputs expands far more slowly.
Figure 2 The demand-pull, sized and sloped
End-market revenue, 2025 and 2030 estimate (US$ bn). CAGR over the period at right.
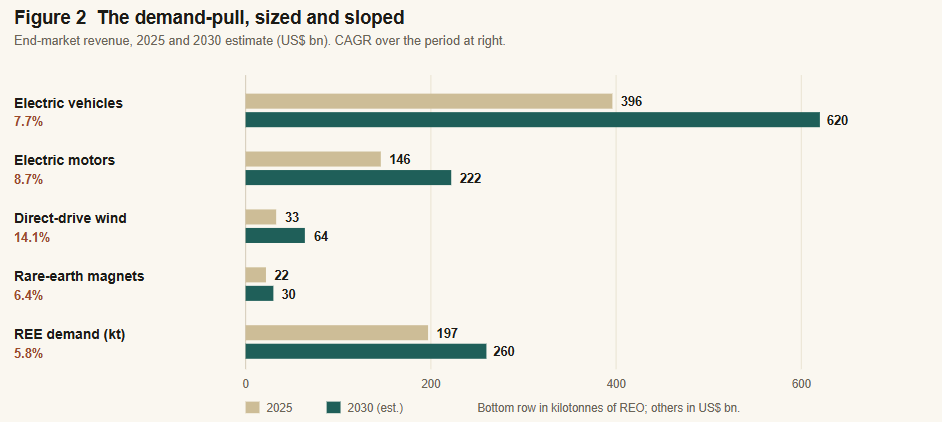
Notes: This chart includes AI‑generated elements and schematic redrawing for illustrative purposes. The chart was created as of June 16, 2026. All quantitative and qualitative references should be verified against the original source data. FIGURE 2a. The magnet-bearing end markets grow at 6 to 14 percent annually, yet physical rare earth volume expands only about 6 percent. The widening gap between revenue growth and material supply is the structural tension the rest of the chain has to absorb. Source: MarketsandMarkets, Mordor Intelligence, Intellect Markets.10
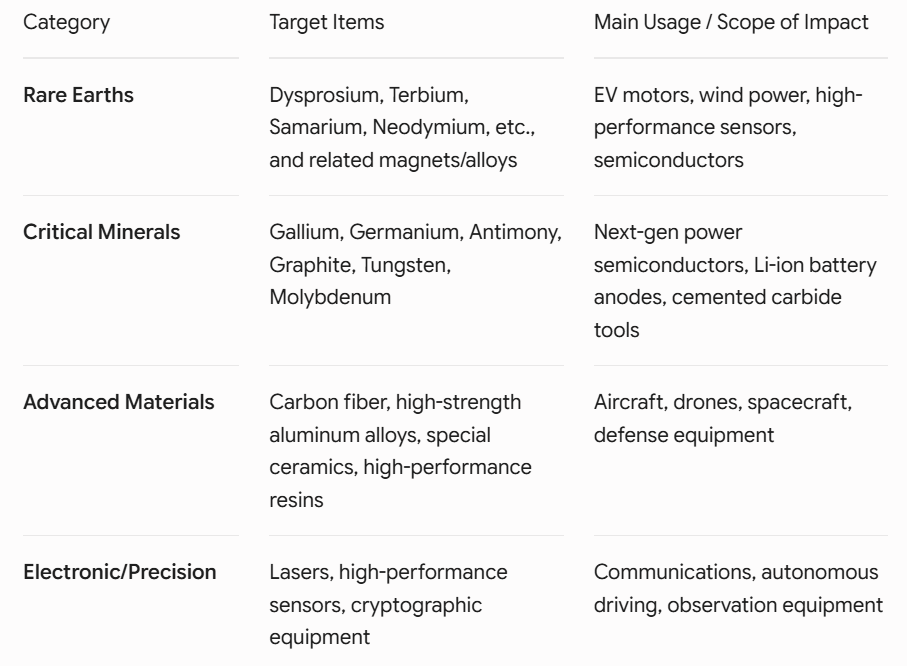
Notes: This chart includes AI‑generated elements and schematic redrawing for illustrative purposes. The chart was created as of June 16, 2026. All quantitative and qualitative references should be verified against the original source data. Figure 2b. Critical Materials and Their Technological Footprint. Applications are indicative rather than exhaustive, and serve to illustrate how specific materials anchor key technologies. Source: USGS Mineral Commodity Summaries 2026; Nikkei Business rare earth survey.
III · The bottleneck is the middle, not the ground
Only now does geography earn its place, and it does so with a twist. Reserves are not the scarce thing. China holds about 44 million tonnes and Brazil about 21 million, but global reserves run to perhaps 130 to 160 million tonnes spread across many jurisdictions.11 If access to ore were the binding constraint, the problem would already be half solved.
The constraint is midstream. China mines roughly 70 percent of global output but performs around 90 percent of chemical separation, close to 99 percent of heavy rare earth separation, and about 94 percent of finished sintered neodymium-iron-boron magnet production.12 Concentration rises at every step downstream of the mine. That is why China’s 2025 export-control sequence, tightening on terbium, dysprosium and other heavies in April, briefly extending to all heavy rare earths in October before a one-year suspension, reverberated through automotive and defense supply chains far out of proportion to the tonnage involved.13 The leverage lives in the separation plant and the magnet line, not the orebody.
Figures 3 and 4 hold that geography and chemistry side by side: where the reserves and the marginal projects sit, and what each of the seventeen elements is for.
Figure 3 Where the reserves sit, and where the mines are
Officially recognized reserves (million tonnes REO) and the ten leading mines and projects, located.
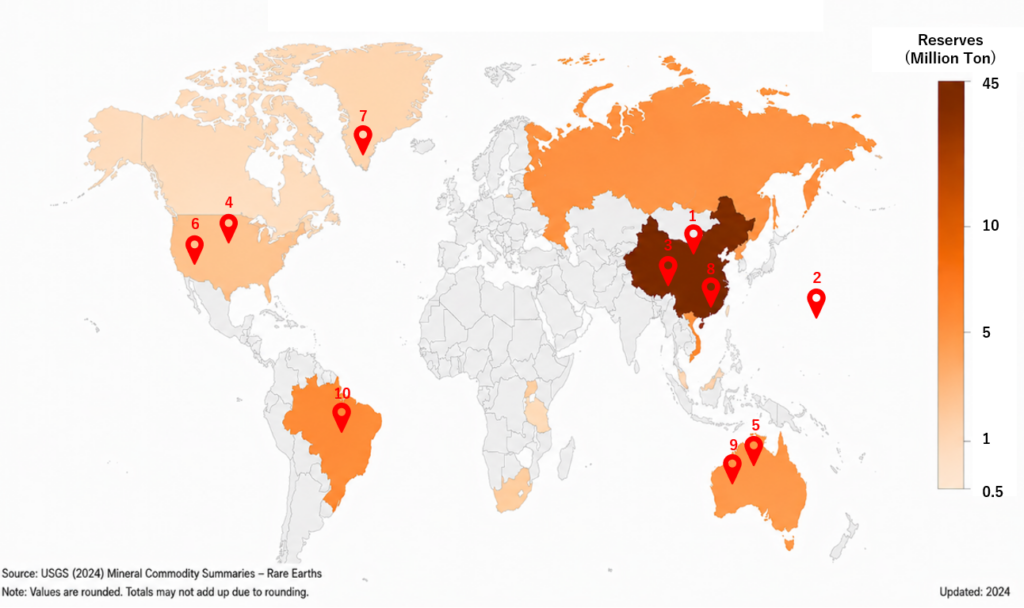
Notes: This chart includes AI‑generated elements and schematic redrawing for illustrative purposes. The chart was created as of June 16, 2026. All quantitative and qualitative references should be verified against the original source data. FIGURE 3a. Reserves are geographically diverse, which is precisely why the supply problem is not a reserves problem. The numbered pins mark the ten leading mines and projects in place; outside China, only Mount Weld, Mountain Pass and Serra Verde are in steady production. Vietnam’s reserve figure was revised down in the 2025 data. Source: USGS Mineral Commodity Summaries 2026; Nikkei Business rare earth survey.14
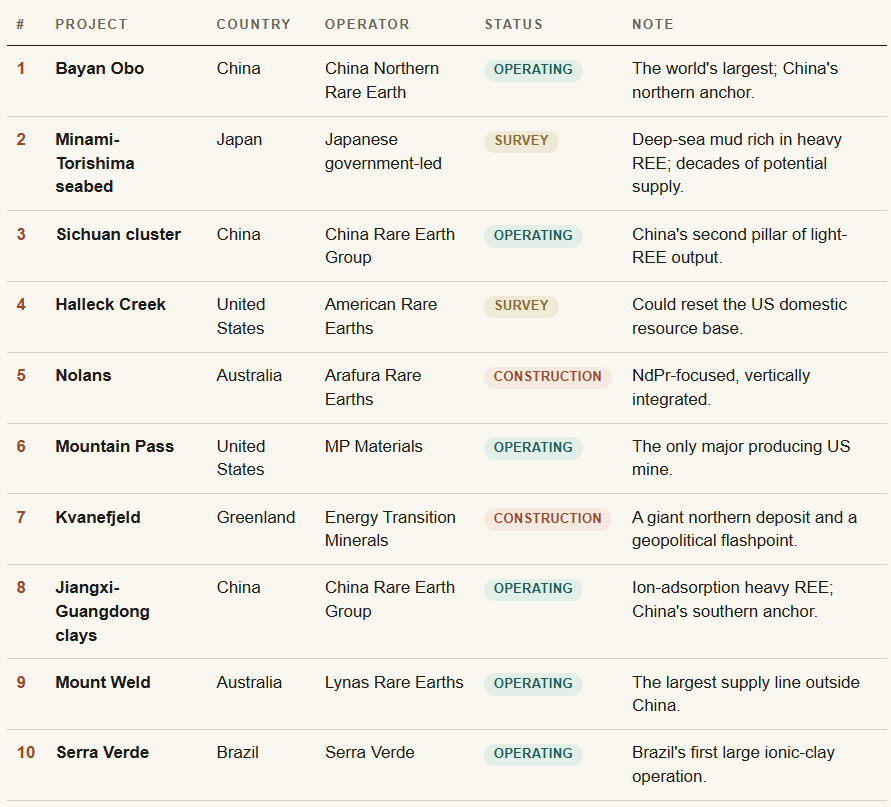
Notes: This chart includes AI‑generated elements and schematic redrawing for illustrative purposes. The chart was created as of June 16, 2026. All quantitative and qualitative references should be verified against the original source data. FIGURE 3b. Ten leading mines and projects by addressable volume. Of the non-China assets, only Mount Weld, Mountain Pass and Serra Verde are in steady production; the rest remain in construction or survey. Source: Nikkei Business; company disclosures.14Figure 4 The seventeen, by scarcity and by job
The reserves picture is matched by a project pipeline that is, for now, lopsided toward exploration and construction rather than operating capacity outside China. The handful of producing non-China assets carries disproportionate strategic weight.
Figure 4 The seventeen, by scarcity and by job
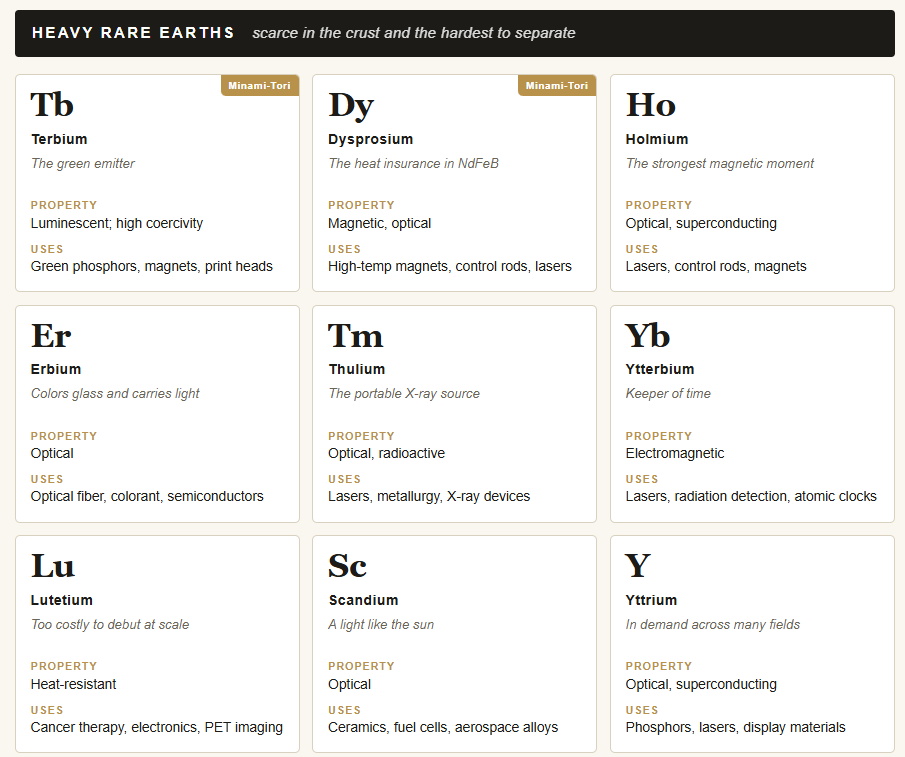
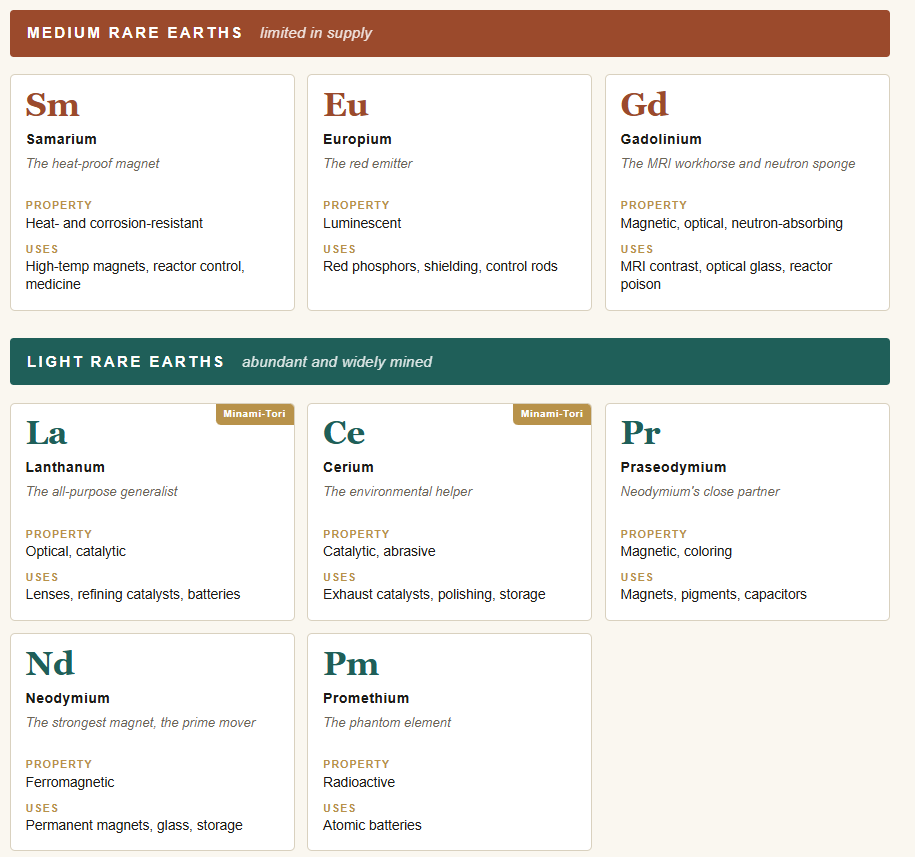
Notes: This chart includes AI‑generated elements and schematic redrawing for illustrative purposes. The chart was created as of June 16, 2026. All quantitative and qualitative references should be verified against the original source data. FIGURE 4. The seventeen, grouped by the resource scarcity that the original Nikkei Business survey emphasizes. Note the pattern: the elements doing the magnet and reactor jobs (Tb, Dy, Sm, Gd) sit in the scarce heavy and medium tiers, while the bulk magnet feedstock (Nd, Pr) sits among the abundant light group. Scandium and yttrium are classed with the heavies here following the source, though their geology differs. Markers indicate elements identified in the Minami-Torishima seabed mud. Source: Nikkei Business rare earth survey.14
IV · What happens next
The demand-side reading points to a clean conclusion that the geopolitics tends to obscure. The world is not running out of rare earths. It is short of separation and magnet capacity outside one country, against demand that is compounding fastest in exactly the scarce heavy fraction that capacity is hardest to build for.
Three adjustments are already underway, and their relative speed will decide the decade. The first is Western mine-to-magnet integration: MP Materials moving downstream into US magnet production, Lynas and Arafura building separation, Serra Verde proving Brazilian ionic clays. The non-China world today makes only perhaps 20,000 to 25,000 tonnes of finished neodymium magnet, with Japan’s Proterial, Shin-Etsu and TDK supplying the larger share; closing the gap is a capital and chemistry problem measured in years, not quarters.15 The second is engineering around the constraint: grain-boundary diffusion that cuts dysprosium dosing, and reduced-heavy or cerium-substituted magnet chemistries of the kind Toyota has demonstrated, each of which lowers the intensity of the scarcest inputs per motor. The third is circularity, with magnet recycling projected to climb from under 2 percent of supply toward more than 10 percent by the early 2030s.16
For Japan, the strategic logic is unusually legible. The constraint is midstream, the country already hosts a large fraction of non-China magnet capability, and the public-private apparatus, from JOGMEC financing to the METI-brokered magnet supply frameworks and the long-horizon Minami-Torishima seabed survey, is aimed squarely at the separation and magnet layer rather than at raw tonnage.17 That is the correct target.
On current trajectories, China’s share of finished magnet supply likely eases from roughly 85 to 90 percent today toward 65 to 70 percent by 2030. Diversified, not displaced.
The investable inference is therefore narrower than the headline anxiety suggests. The scarcity that prices is not neodymium, which is abundant enough and increasingly substitutable, but the heavy pair, dysprosium and terbium, and the separation and magnet capacity that turns any of it into a finished part. Assets with secured heavy-rare-earth separation, floor-priced magnet offtake, or genuine recycling throughput hold the leverage. Everyone else is selling ore into a market whose real bottleneck sits several steps downstream of the mine. Demand decides, and demand has already chosen the middle of the chain.
Viewed broadly, global rare-earth supply chains are undergoing a structural realignment driven not by geological scarcity but by the distribution of processing and magnet‑making capacity, and by the accelerating demand from technologies such as EVs, wind power, robotics, and advanced electronics. While China is expected to remain the largest producer, its share of refined materials and finished magnets is likely to gradually decline as new projects, midstream capacity, and recycling initiatives expand in other regions. The critical constraints lie in heavy‑rare‑earth separation, high‑performance magnet production, and the ability to scale these capabilities in line with demand. Companies and countries that secure these midstream functions—rather than simply mining ore—will shape the resilience and competitiveness of the global supply chain.
Notes
- Nd2Fe14B carries the highest maximum energy product of commercial permanent magnets; application mapping synthesized from IEA, “Rare Earth Elements: Pathways to Secure and Diversified Supply Chains,” 2026, and materials literature.
- Curie temperatures of roughly 585 K (Nd2Fe14B), 602 K (Dy) and 639 K (Tb); EV traction motors operate near 160°C. Grain-boundary diffusion of Dy/Tb raises coercivity and thermal stability. USPTO patent literature; Daido Steel, Materials 16(19), 2023.
- Sm-Co magnets hold a higher Curie temperature without dysprosium but lower magnetization; preferred for high-heat aerospace and defense applications. USPTO patent literature.
- Gd-157 thermal-neutron capture near 254,000 barns; gadolinia is the most common burnable poison in commercial BWR and PWR fuel, with samarium and erbium in related roles. ScienceDirect; OSTI burnable-poison studies.
- Magnets represented about 31.2% of rare earth demand by value in 2025, the largest single application. IMARC Group; Mordor Intelligence.
- Approximately 1.5 kg NdFeB per BEV across roughly 95% of platforms; global EV stock projected above 300 million by 2030. IEA, Global EV Outlook; Persistence Market Research.
- Direct-drive offshore generators use roughly 200 to 600 kg of magnet per MW; offshore wind capacity projected to rise from about 64 GW (2022) to 380 GW (2030). Persistence Market Research; industry estimates.
- Magnet rare earth demand projected to rise about 30% by 2030; EV share of that demand rising from about 9% to 18%. IEA, 2026.
- Per-platform figures: F-35 about 418 kg, Arleigh Burke destroyer about 2,600 kg, Virginia-class submarine about 4,600 kg. US military magnet demand of 3,000 to 4,000 tonnes per year projected toward 10,000 by 2030. Benchmark Mineral Intelligence; US Department of Commerce.
- Market figures: rare-earth magnets US$22.0 bn (2025) to US$30.0 bn (2030), 6.4% CAGR (MarketsandMarkets / ResearchAndMarkets); direct-drive wind US$33 bn (2024) to US$63.6 bn (2030), 14.1% (Intellect Markets); electric motors US$146.4 bn to US$222.0 bn, 8.7% (Mordor Intelligence); EV market US$396 bn (2024) to US$620 bn (2030), 7.7% (MarketsandMarkets); REE volume 196.6 to 260.4 kt, 5.8% (Mordor Intelligence).
- China about 44 Mt, Brazil about 21 Mt; global reserves estimated at 130 to 160 Mt. USGS Mineral Commodity Summaries 2026.
- China shares: about 70% mining, about 90% separation, near 99% heavy-REE separation, about 94% sintered NdFeB magnet output. USGS, IEA, Adamas Intelligence.
- China’s 2025 export-control sequence: April controls on terbium, dysprosium, lutetium and others; October expansion to all heavy rare earths; November one-year suspension of the October measures, with the April controls remaining as of December 2025. USGS Mineral Commodity Summaries 2026.
- Reserves and project rankings adapted from USGS Mineral Commodity Summaries 2026 and the Nikkei Business rare earth survey (2026.04.27 to 05.04). Figure 4 element groupings and the Minami-Torishima markers follow the placement in that survey.
- Non-China finished NdFeB magnet output estimated at roughly 20,000 to 25,000 tonnes, with Japanese producers (Proterial, Shin-Etsu, TDK) the largest contributors. Adamas Intelligence; company disclosures.
- Reduced-heavy and cerium-substituted magnet chemistries (including Toyota’s demonstrated Nd-reduced design) and grain-boundary diffusion lower per-unit heavy-REE intensity; magnet recycling projected to rise from under 2% toward over 10% of supply by the early 2030s. IMARC Group; e-Mobility Engineering.
- Japanese supply-security measures include JOGMEC financing, METI-brokered magnet supply frameworks (such as the 2025 TDK and Siemens Gamesa arrangement), and the government-led Minami-Torishima seabed survey. Company and ministry disclosures.