

Photo by Taylor Vick on Unsplash. This article contains AI‑generated content. Please exercise your own judgment and independently verify any important points.
Compute has become a utility-scale load. A survey of where the world’s AI data centers stand today, where they will stand in 2030, who pays for the electrons, who profits from delivering them, and whether the buildout accelerates the energy transition or quietly entrenches combustion.
Every technological revolution eventually presents an invoice denominated in physical units. The railway demanded steel; the automobile demanded oil; artificial intelligence demands electrons, and in quantities that have begun to reorganize the world’s power systems. Global data centers consumed roughly 415 terawatt-hours of electricity in 2024, a figure the International Energy Agency expects to more than double to approximately 945 TWh by 2030, equivalent to absorbing the entire present electricity consumption of Japan, before climbing past 1,300 TWh by 2035.FN1 The growth is not incremental but inflective: data center electricity demand rose 17 percent in 2025 alone, against 3 percent for global electricity demand overall, while the capital expenditure of the five largest technology companies surpassed $400 billion in 2025 and is guided to rise a further 75 percent in 2026.FN2 The IEA’s framing is deliberately provocative. Investment in data centers reached an estimated $580 billion in 2025, exceeding the $540 billion the world spent on its entire oil supply.FN3 Data, in the most literal capital-allocation sense, has overtaken oil.
I. The Geography of Compute
The physical footprint follows the capital. JLL’s 2026 Global Data Center Outlook places worldwide capacity at 103 gigawatts of IT load today, nearly doubling to 200 GW by 2030, an expansion requiring as much as $3 trillion in total investment over five years, including roughly $1.2 trillion in new real estate asset value and $870 billion in debt financing.FN4 The Americas hold approximately half of global capacity, on the order of 51 GW, and are forecast to grow fastest at a 17 percent compound annual rate, implying a region of roughly 110 GW by 2030; the United States alone accounts for about 90 percent of that regional total.FN5 APAC is projected to expand from 32 GW to 57 GW at a 12 percent CAGR, led by colocation in hubs such as Johor, Tokyo, and Sydney, while EMEA adds about 13 GW at a 10 percent CAGR, concentrated in London, Frankfurt, and Paris alongside emerging Middle Eastern markets pursuing sovereign AI strategies.FN5 The constraint binding all three regions is no longer land, fiber, or even chips but interconnection: grid connection lead times in primary markets now average four years or more, which explains the migration of hyperscale development into secondary geographies, from North Dakota and West Texas to Hokkaido and Johor, wherever electrons can be secured faster than queues can lengthen.FN4
DATA CENTER CAPACITY BY REGION
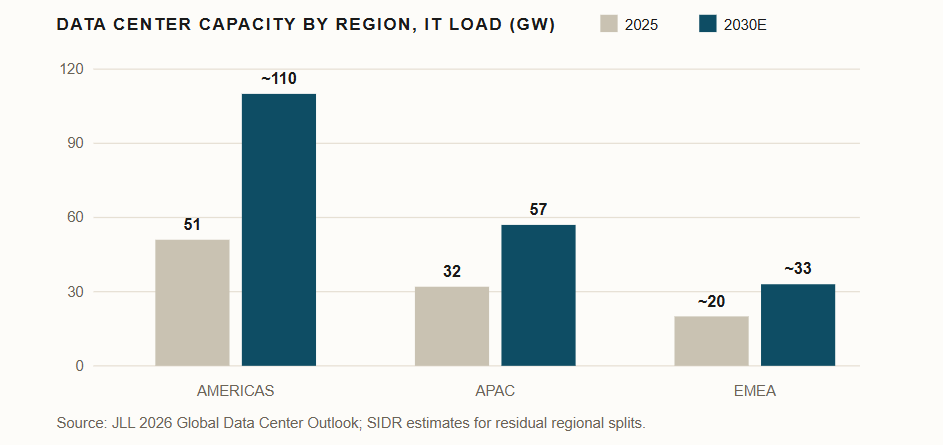
This illustration includes AI‑generated elements and may contain inaccuracies. Please verify critical figures against primary sources before use in analysis or decision-making. Capacity figures represent IT load (GW) and reflect JLL’s 2026 Global Data Center Outlook with SIDR regional adjustments. 2030E values are estimates and subject to revision as market conditions, AI-driven demand, and grid constraints evolve.
II. The Electron Bill, Itemized by Region
Translated into electricity, the buildout is even more concentrated than the real estate suggests. The IEA projects that the United States and China together account for nearly 80 percent of global data center demand growth to 2030: American consumption rises by roughly 240 TWh, an increase of 130 percent over 2024 levels, while Chinese consumption rises by approximately 175 TWh, up 170 percent.FN6 Europe adds a comparatively modest 45 TWh, up 70 percent, and Japan around 15 TWh, an increase of more than 80 percent, with Japan and Korea together holding about 5 percent of global data center demand through the decade.FN6 By 2030 the United States is expected to draw roughly 430 TWh for data centers, about 45 percent of the global sector, against China’s 280 TWh.FN7 Two qualifications discipline the headline numbers. First, even at 945 TWh, data centers would represent only around 3 percent of global electricity consumption in 2030; the macro story is one of geographic concentration rather than planetary share.FN6 Second, in the economies where that concentration occurs, the effect is transformative: roughly half of all electricity demand growth in both the United States and Japan over the next five years is attributable to data centers, in power systems where demand had been flat or declining for a generation.FN8
DATA CENTER ELECTRICITY DEMAND GROWTH, 2024–2030 (TWh)
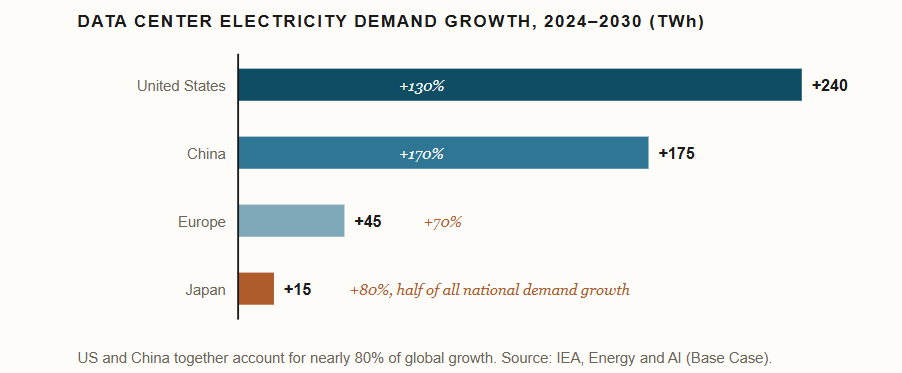
This illustration incorporates AI‑generated elements and may contain inaccuracies. Please verify quantitative values against primary sources before using them for analysis or decision-making. Demand growth figures reflect incremental electricity consumption attributable to data centers through 2030, based on the IEA Energy and AI Base Case. Regional percentages denote cumulative growth relative to 2024 levels; TWh values represent absolute increases. Japan’s estimate highlights its disproportionate impact on national demand growth despite smaller absolute volumes.
III. The Grid Supercycle and Its Beneficiaries
Meeting this demand requires capital on a scale the power sector has not deployed in decades, and the spending is arriving asymmetrically. Global investment in electricity generation has climbed nearly 70 percent since 2015 to roughly $1 trillion per year, yet annual grid spending has grown at less than half that pace, reaching about $400 billion, a mismatch that manifests as congestion, curtailment, negative wholesale pricing, and more than 2,500 GW of generation, storage, and large-load projects stalled in interconnection queues worldwide.FN9 BloombergNEF estimates grid capital spending exceeded $470 billion in 2025, up 16 percent year on year, with the United States alone deploying $115 billion, while the IEA calculates that annual grid investment must rise approximately 50 percent by 2030 merely to keep pace.FN10 The bottleneck, in other words, is the order book, and the order book is where the equity story lives.
The scarcest commodity in the AI economy is not the GPU but the grid connection, and the companies that manufacture deliverance from the queue are being repriced accordingly.
No company illustrates the repricing more vividly than GE Vernova. In the first quarter of 2026 the firm booked $18.3 billion in orders, up 71 percent organically, lifting total backlog from $116 billion to $163 billion; its Electrification segment alone took $2.4 billion of data center equipment orders in a single quarter, more than in all of 2025, and management now guides to at least 110 GW of combined gas turbine backlog and slot reservations by year-end.FN11 The pattern repeats across the supply chain. Transformer lead times stretch beyond two years, gas turbine orders surged roughly 70 percent in 2025, and Hitachi Energy, Siemens Energy, Schneider Electric, Eaton, Mitsubishi Heavy Industries, Vertiv, and cable makers such as Nexans, Fujikura, and Sumitomo Electric all report multi-year backlogs as every segment from switchgear to high-voltage cable tightens simultaneously.FN12 A second beneficiary class sits upstream of the meter: incumbent nuclear generators monetizing existing capacity through hyperscaler power purchase agreements, exemplified by Vistra’s twenty-year contracts with Amazon and Meta and Constellation’s portfolio of deals with Microsoft and Meta, alongside engineering and construction firms such as Quanta Services and MasTec, whose management estimates the addressable grid opportunity at $2.4 trillion through 2030.FN13 The risks are equally legible: extended valuations, regulatory pressure to shift grid costs onto hyperscalers rather than ratepayers, and the perennial possibility that AI capital expenditure disappoints and tight power markets loosen abruptly.FN13
IV. Transition Accelerant or Combustion Renaissance?
The decisive question for energy policy is whether this demand wave pulls the transition forward or finances its postponement, and the honest answer is that it does both, in a ratio that favors decarbonization but not unconditionally. In the IEA’s base case, renewables, principally wind, solar, and hydro, meet nearly half of incremental data center demand to 2030, lifting their share of data center supply from 27 percent today to roughly 50 percent, with renewable generation for data centers expanding by more than 450 TWh by 2035.FN14 Yet natural gas supplies a substantial second tranche, growing by around 175 TWh, overwhelmingly in the United States, where pro-gas policy and the imperative of speed have produced a wave of dedicated gas plants, including GE Vernova turbines powering facilities built by Chevron and Engine No. 1 for Microsoft’s AI workloads.FN14 Coal remains the single largest source of data center electricity today at about 30 percent, concentrated in China, where nearly 100 GW of new coal plants were approved in 2024 even as advanced economies recorded zero new coal turbine orders for the first time.FN15 The combustion renaissance is real, but it is regionally specific and, in the IEA’s modeling, transitional: across all scenarios renewables meet most additional data center demand to 2035, with nuclear assuming a growing role late in the decade.FN14
Storage is where the demand wave most unambiguously accelerates the transition. Global battery additions exceeded 75 GW in 2024, investment in storage is running above $65 billion annually, and the IEA projects that 20 to 25 GW of battery capacity could be installed inside data centers themselves by 2030, converting the grid’s most demanding new customer into a potential flexibility asset.FN16 Solar-plus-storage is expected to become a standard component of data center energy procurement by 2030 as renewable costs undercut fossil alternatives across all major regions.FN17 Nuclear, similarly, is enjoying a demand-driven rehabilitation, with global investment in new plants and refurbishments exceeding $70 billion and small modular reactor interest compounding.FN15 The balance sheet of the AI power boom, then, reads roughly as follows: an unambiguous acceleration of renewables, storage, and nuclear; a significant but geographically concentrated expansion of gas in the United States; and a coal tail in China that owes more to domestic energy security doctrine than to data centers per se.
WHO SUPPLIES THE DATA CENTER? SHARE OF ELECTRICITY
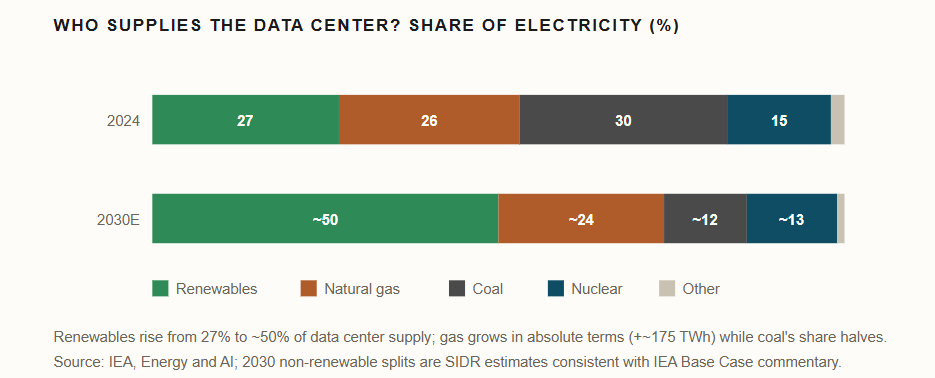
This illustration includes AI‑generated elements and may contain inaccuracies. Please verify quantitative values against primary sources before using them for analysis or decision-making. Electricity supply shares reflect the composition of power used by data centers in 2024 and estimated levels for 2030. Renewable energy’s share increases substantially, while coal declines and natural gas grows modestly in absolute terms. Non‑renewable splits for 2030E incorporate SIDR adjustments aligned with IEA’s Energy and AI Base Case commentary.
V. Japan: Kyushu’s Battery Rush and the Nuclear Restoration
Japan offers the demand wave in miniature, and with unusual clarity, because the country is simultaneously short of power and long on curtailed sunshine. Kyushu, the national epicenter of solar penetration and therefore of midday curtailment, has become the proving ground for grid-scale storage: battery projects have proliferated across the island as developers arbitrage the spread between near-worthless midday solar and scarce evening power, with utilities and contractors including Kyudenko examining entry into the business.FN18 National policy now formalizes the trend. METI’s revised Battery and Power Source Industry Strategy of June 2026 designates grid storage as indispensable infrastructure for renewable integration and for backup of data centers and communications, within a global lithium-ion market it expects to double from 23 trillion yen in 2025 to 46 trillion yen by 2035.FN19 On the nuclear side, restoration has hardened into expansion: with fourteen reactors restarted and Kyushu Electric’s Sendai and Genkai units among the fleet’s workhorses, the government in June 2026 set a target of replacing up to five aging reactors by the 2040s, roughly 5.5 GW or a fifth of existing capacity, while utilities study new construction on a 2040 to 2050 horizon.FN20 Independent analysis cautions that the official 2040 generation share targets are achievable only under maximal restart scenarios, a reminder that Japanese nuclear ambition still runs ahead of Japanese nuclear execution.FN21 For the data center economy, which is expected to absorb half of Japan’s demand growth this decade, the strategic logic is nonetheless coherent: batteries to harvest Kyushu’s surplus photons, reactors to anchor the baseload, and both insulated from the maritime chokepoints on which Japanese LNG depends.FN6
VI. Hydrogen After Hormuz
That last clause carries unusual weight in June 2026. Since late February, the war between Iran and the US-Israel coalition has kept the Strait of Hormuz, the conduit for roughly a fifth of seaborne oil and a fifth of global LNG, effectively closed, with transits collapsing to around 5 percent of pre-conflict levels in what the IEA has characterized as the largest supply disruption in the history of the oil market.FN22 The crisis has inverted the conventional energy security narrative: fuels once prized as dependable now arrive through a contested chokepoint, while domestically generated renewables, storage, and nuclear suddenly read as the secure portfolio, a reframing energy economists describe as a structural flip in the security debate.FN23 For hydrogen, the implications cut in two directions. The shock plainly accelerates demand-side interest, since hydrogen and ammonia produced outside the Gulf, or moved through routes that bypass Hormuz, offer importers such as Japan precisely the diversification the crisis has made urgent, and Gulf producers themselves are responding by reweighting toward electricity and hydrogen export models, exemplified by Saudi Arabia’s NEOM green hydrogen project and cross-border interconnection schemes.FN24 Yet the same instability threatens the supply side it is meant to summon: the Middle East was positioned as the world’s green hydrogen hub, and the World Economic Forum warns that uncertainty over shipping lanes and investment will likely delay electrolyser buildout and export infrastructure.FN25 The most defensible synthesis is that Hormuz accelerates hydrogen as a strategic doctrine while retarding it as a Gulf-centered industry, shifting the locus of credible projects toward Australia, North America, India, and domestic production in importing nations. Whether AI demand itself accelerates hydrogen is a more sober calculus: electrolytic hydrogen must compete for the very renewable electrons that data centers are bidding up, which argues that hydrogen’s near-term role in the AI power stack will remain peripheral even as its geopolitical stock rises.
VII. Coda
The AI buildout is best understood not as an energy crisis but as a forced modernization, compressed into half a decade and paid for by the most creditworthy customers the power sector has ever encountered. It will add gas plants in Texas and prolong coal in China, and those tons of carbon are real. But it is also underwriting the largest grid investment cycle on record, an unambiguous boom in batteries and renewables, the commercial rehabilitation of nuclear power from Pennsylvania to Kyushu, and, after Hormuz, a strategic premium on every kilowatt-hour that does not transit a strait. The transition was always going to require demand. It has now found a customer that cannot wait.
References
- International Energy Agency, Energy and AI, April 2025; S&P Global Commodity Insights, “Global data center power demand to double by 2030 on AI surge: IEA,” April 10, 2025.
- International Energy Agency, Key Questions on Energy and AI, April 2026.
- International Energy Agency, World Energy Outlook 2025, Executive Summary, November 2025.
- JLL, 2026 Global Data Center Outlook, January 2026.
- JLL, ibid.; Data Center Knowledge, “Why Global Data Centers Are Entering an Investment Supercycle,” March 2026.
- International Energy Agency, Energy and AI, “Energy demand from AI” and “Energy supply for AI” chapters.
- Incorrys, “Power Consumption of Data Centers,” November 2025, based on IEA projections.
- Carbon Brief, “AI: Five charts that put data-centre energy use and emissions into context,” September 2025.
- International Energy Agency, World Energy Outlook 2025; IEA, Electricity 2026, Grids chapter.
- BloombergNEF, Grid Investment Outlook 2025, December 2025; IEA, Electricity 2026.
- GE Vernova Inc., Form 8-K and Q1 2026 press release, April 22, 2026.
- International Energy Agency, Key Questions on Energy and AI, April 2026; Power Supply for Data Centers 2026 conference materials; 24/7 Wall St., “How AI Data Centers Are Reshaping the Power Market,” May 2026.
- 24/7 Wall St., ibid., May 2026.
- International Energy Agency, Energy and AI, “Energy supply for AI”; Data Center Dynamics, “IEA: Data center energy consumption set to double by 2030 to 945TWh,” 2026.
- International Energy Agency, World Energy Investment 2025, Executive Summary.
- International Energy Agency, World Energy Outlook 2025; IEA, World Energy Investment 2025; IEA, Key Questions on Energy and AI.
- JLL, 2026 Global Data Center Outlook, energy strategy commentary.
- Nikkei, “九州で再エネ蓄電池の設置相次ぐ、九電工も検討” (Renewable battery installations multiply in Kyushu; Kyudenko also considering entry).
- Ministry of Economy, Trade and Industry, 蓄電池・電源産業戦略 (Battery and Power Source Industry Strategy), Battery Industry Strategy Council, June 2, 2026.
- Nikkei, “原発建て替え40年代に最大5基 政府が目標、既存設備の最大2割分” (Government targets up to five nuclear replacements by the 2040s, up to 20% of existing capacity), June 4, 2026.
- Renewable Energy Institute, “原子力発電の2030/2040年度の見通し、シナリオ別に見る現実性” (Outlook for nuclear power in FY2030/2040 by scenario), March 2025.
- Congressional Research Service, Iran Conflict and the Strait of Hormuz: Impacts on Oil, Gas, and Other Commodities, 2026; UK House of Commons Library, Israel/US-Iran conflict 2026: Reopening the Strait of Hormuz, June 2026.
- CNBC, “How the Strait of Hormuz standoff flipped the energy security debate,” June 5, 2026.
- Gulf International Forum, “The Strait of Hormuz Closure and the Reshaping of Energy Geopolitics,” June 2026.
- World Economic Forum, “Beyond oil: 9 commodities impacted by the Strait of Hormuz crisis,” April 2026.
This article contains AI‑generated content. Please exercise your own judgment and independently verify any important points.