

Photo by Rebecca Muller on Unsplash. This article contains AI‑generated content. Please exercise caution and verify all critical information with primary sources before using it for analysis or decision‑making. This article is prepared for informational purposes only for readers and does not constitute investment advice, an offer, or a solicitation. Two charts in this article are schematic redrawings and include approximations. Forward-looking statements regarding the Iran conflict, the IPO calendar, data center delivery, and energy transition pathways are inherently uncertain. The Fire Horse is a metaphor; position sizing should not be.
Defense equities have quietly become the best-informed war correspondents in the market. We read the iShares U.S. Aerospace & Defense ETF as a barometer of the Iran conflict, trace how a crowded IPO calendar is draining the equity market’s plumbing, and ask what a stalled buildout of American data centers means for the energy transition in a year the Japanese calendar warned us about.
Markets are not clairvoyant, but they are extraordinarily good listeners. Among the instruments most worth listening to in 2026 is ITA, the iShares U.S. Aerospace & Defense ETF, which Daiwa Securities analyst Kinouchi argues has repeatedly functioned as a directional indicator for the trajectory of armed conflict itself.FN1 The logic is unsentimental: defense revenues are a derivative of expected hostilities, and the investors who price those revenues aggregate procurement chatter, satellite imagery, and Beltway whispers faster than any single newsroom.FN2 When ITA rallies, the market is not celebrating war; it is forecasting it.FN3
The year-to-date tape reads like a war diary written in price. ITA was elevated in the opening weeks of the year as the Venezuela intervention unfolded, and it carved out a conspicuous peak around the onset of the Iran war.FN4 The inflection came in April: ceasefire negotiations convened on April 5, and on April 13 the U.S. Navy executed what is best described as a reverse blockade of the Strait of Hormuz, sealing the waterway from the outside to control escalation rather than commerce.FN5 From that point ITA bled steadily lower, the market’s way of saying that the most violent phase of repricing was behind it.FN6
That verdict is now being revised. Over the past several weeks ITA has turned decisively higher, closing the gap toward its spring highs, and the news flow explains why: an American helicopter was shot down, the administration retaliated, and Tehran retaliated against the retaliation.FN7 The escalation ladder, in other words, has resumed its familiar geometry, and the ETF that called the war’s beginning is no longer pricing its end.FN8 As of June 11, ITA trades at 229.56, up 6.7 percent year to date and 2.1 percent on the session, a performance profile that belongs to an asset hedging an unfinished conflict rather than mourning a concluded one.FN9 Crude oil, meanwhile, sits below its panic highs but remains stubbornly elevated, a persistence premium that the physical market refuses to surrender while the strait remains a chokepoint under naval management.FN10
ITA AS WAR BAROMETER: A STYLIZED YTD
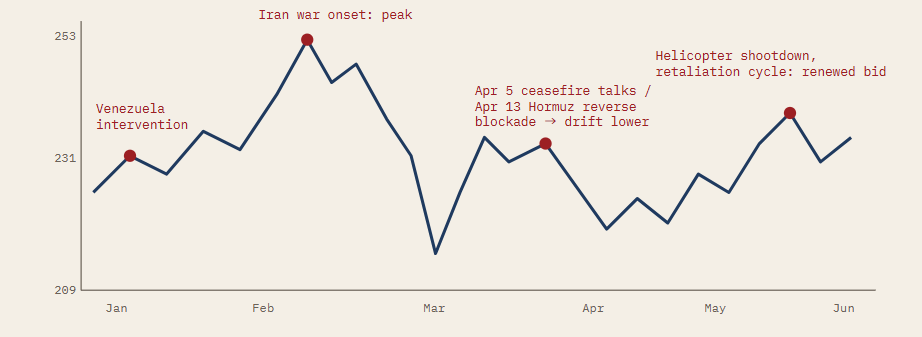
Notes: This chart is a schematic redrawing and includes approximations. This illustration contains AI‑generated content and may include inaccuracies or omissions. Please verify all quantitative values with primary sources before use. Stylized representation of the ITA year-to-date price path (USD), annotated with the principal geopolitical inflection points. Schematic; not to exact scale. Source: CBOE BZX real-time quote, June 11, 2026; S1:DR illustration.
A Market That Must Sell Its Winners to Buy Its Future
If geopolitics is the market’s weather, supply and demand of shares is its plumbing, and the pipes are groaning. Equity indices have whipsawed in recent weeks ahead of the SpaceX initial public offering, the largest and most psychologically significant listing of the cycle.FN11 Behind SpaceX stands a queue: with fundraising through private credit markets becoming materially harder, a procession of giant AI companies has elected to seek capital in public markets instead.FN12 The private market’s loss is the public market’s burden, because every dollar committed to a new listing is a dollar that must first be liberated from an old position.FN13
This is the mechanism behind the curious weakness in the year’s erstwhile winners. Profitable names and benchmark indices have been sold down, not on deteriorating fundamentals, but because institutions are raising cash to absorb the coming mega-IPOs, a rotation that strategists describe as the market making room at the table.FN14 Layered atop this is the rates problem: a run of robust U.S. employment data has pushed yields toward levels that equity investors can no longer dismiss as noise, compressing the multiple at precisely the moment the market is being asked to digest record issuance.FN15 Demand for shares is being rationed just as the supply of shares is set to surge, which is the textbook recipe for the volatility now visible on every screen.FN16
“When the supply-demand balance of the stock market breaks, that is what can puncture the AI bubble.”— Emin Yilmaz, 90 SECONDS, PARAPHRASEDFN17
The warning deserves to be taken literally rather than rhetorically. The AI trade has to date been underwritten by an assumption of limitless capital: limitless venture money, limitless private credit, limitless public appetite.FN18 The first two assumptions have already failed, which is why the IPO queue exists at all, and the third is now being stress-tested in real time by rising rates and a war premium in crude.FN19 A bubble rarely ends because the technology disappoints; it ends because the financing does.FN20
Forty Gigawatts of Maybe
The physical economy is sending its own signal. Data compiled by the SynMax Vulcan Platform and IIR Energy, reported by the Financial Times and aired on Japanese financial television this week, show that the American data center buildout is slipping badly behind its own promises.FN21 Of capacity slated for 2025 delivery, roughly 40 percent was delayed by more than 90 days or had not broken ground; for the 2026 vintage the figure exceeds 60 percent; and for 2027, the overwhelming majority of announced gigawatts remain unstarted, a violet smear of intention on a chart otherwise denominated in concrete.FN22
US DATA CENTER CONSTRUCTION STATUS BY DELIVERY YEAR (GW)
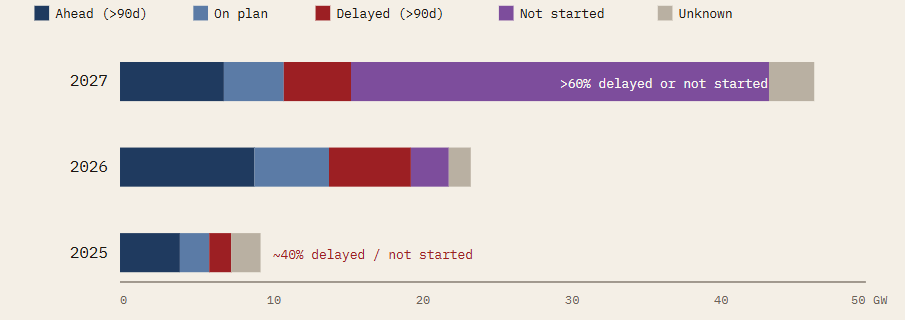
Notes: This chart is a schematic redrawing and includes approximations. This illustration contains AI‑generated content and may include inaccuracies or omissions. Please verify all quantitative values with primary sources before use. Construction status of announced U.S. data center capacity by scheduled delivery year, gigawatts. Approximate values, redrawn from broadcast graphics. Source: SynMax Vulcan Platform; IIR Energy (as of April 9, 2026), excerpted from the Financial Times.
Two readings of this chart are possible, and they point in opposite directions. The bearish reading treats the delays as revealed preference: hyperscalers announce gigawatts for the benefit of equity narratives but commit concrete only where returns are visible, and the widening gap between announcement and groundbreaking is the bubble confessing to itself.FN23 The charitable reading blames the bottlenecks, since turbines, transformers, transmission interconnects, and skilled electrical labor are all rationed goods in 2026, and a project delayed by its grid queue is not a project abandoned by its economics.FN24 The truth is likely an uncomfortable blend, but for investors the distinction is almost academic: either way, the revenue recognition embedded in AI infrastructure valuations arrives later than the spreadsheets assume, at exactly the moment the equity market’s capacity to forgive has been thinned by the IPO calendar.FN25
War, Watts, and the Carbon Ledger
The Iran war and the data center stall are usually filed in separate drawers, geopolitics and technology, but they converge on a single commodity: energy, and behind it, the climate ledger. The conflict’s most direct effect is the persistence of elevated oil prices, which historically cuts both ways for decarbonization: expensive crude accelerates electrification of transport and improves the relative economics of renewables, even as it tempts producers into new upstream investment and governments into energy-security maximalism that privileges any domestic molecule, clean or otherwise.FN26 A Hormuz under naval lock concentrates minds in Tokyo, Seoul, and Brussels on the oldest lesson of energy policy, which is that the cheapest barrel is the one you do not need to import.FN27
The data center slowdown complicates the picture further. The AI buildout had become the single most powerful demand signal for new generation in the United States, underwriting nuclear restarts, small modular reactor pipelines, grid-scale storage, and, less gloriously, a fleet of new gas turbines.FN28 If forty-odd gigawatts of demand arrive late or never, the near-term effect is paradoxically green, as the gas plants ordered in panic become the most likely casualties of cancellation, while the long-term effect is ambiguous, since it was precisely AI’s voracious load growth that gave utilities the commercial confidence to invest in clean firm power at scale.FN29 A punctured AI bubble would therefore relieve the grid and starve the energy transition’s most enthusiastic financier in the same motion.FN30 War, for its part, carries its own carbon account, from the Scope 1 emissions of carrier groups loitering off the Gulf to the methane shadow of damaged infrastructure, a cost that appears in no earnings release but accrues to everyone.FN31
A Fable for the Year of the Fire Horse
By the old Japanese calendar, 2026 is hinoeuma, the Year of the Fire Horse, an omen that arrives once every sixty years and was once feared enough to bend the nation’s birth rate.FN32 The superstition holds that those born under the fire horse are too spirited to be governed, beautiful and ungovernable in equal measure, and the market of 2026 has spent six months auditioning for the role.FN33
Permit us, then, a fable. A horse made of fire was led to market, and the merchants quarreled over its price. The generals bid first, for a fire horse wins wars, and ITA recorded their bids faithfully. The engineers bid next, promising that if they could only feed the horse enough electricity it would think for them, though many of their stables, on inspection, had not yet been built. The bankers bid last and largest, but to raise their bid they had to sell the older, gentler horses that had carried them all year, and the whole paddock grew skittish. The horse, being made of fire, consumed a little of whatever touched it: the oil price, the bond market, the carbon budget, the certainties of every bidder. No one in the fable owns the horse at the end, because a fire horse is not owned; it is ridden, briefly, by whoever respects it most and leans furthest forward with the loosest grip.
The translation out of fable is brief. The renewed ascent of defense equities says the war is not over, whatever the communiqués imply.FN34 The IPO queue says the AI trade’s financing regime has changed permanently, and the data center chart says its physical delivery was always slower than its narrative.FN35 Elevated rates say the price of believing in all of it has gone up. Our advice for the second half of 2026 is the rider’s advice: stay mounted if you must, respect the animal, keep the grip loose, and do not mistake the heat on your face for the warmth of certainty. Volatility is not the anomaly of the Fire Horse year; it is the curriculum.FN36
References
- Eiji Kinouchi, Daiwa Securities, equity strategy commentary on ITA (iShares U.S. Aerospace & Defense ETF) as a directional indicator of conflict trajectories, June 2026.
- S1:DR framework note: defense sector cash flows as derivatives of expected hostilities; price discovery as information aggregation.
- Ibid.; interpretation of defense equity rallies as conflict forecasts rather than sentiment.
- ITA price history, January–February 2026: elevated levels during the Venezuela intervention and a local peak at the onset of the Iran war. CBOE BZX trading data.
- Ceasefire negotiations of April 5, 2026, and the U.S. Navy reverse blockade of the Strait of Hormuz commencing April 13, 2026; wire reports and Daiwa Securities commentary.
- ITA price history, mid-April to late May 2026; sustained drawdown following the Hormuz operation.
- Wire reports, May–June 2026: downing of a U.S. helicopter, subsequent U.S. administration retaliation, and Iranian counter-retaliation.
- S1:DR interpretation of the resumed escalation cycle as reflected in defense equity pricing.
- CBOE BZX real-time quote, ITA, June 11, 2026, 09:54 EDT: 229.56 USD, +2.09% intraday, +6.70% year to date.
- Brent and WTI front-month price behavior, April–June 2026: retreat from conflict highs with persistent elevation above pre-war baseline.
- Equity index volatility ahead of the SpaceX initial public offering; see also S1:DR, “SpaceX IPO: Anchor Tenancy, Starlink, and Orbital Data Centers,” 2026.
- Tightening conditions in private credit markets, H1 2026, and the resulting migration of large AI issuers toward public listings.
- S1:DR analysis: portfolio cash-raising as the funding mechanism for primary issuance absorption.
- Institutional rotation out of profitable incumbents and index products ahead of the mega-IPO calendar; sell-side flow commentary, May–June 2026.
- U.S. employment reports, spring 2026, and the associated repricing of Treasury yields toward equity-relevant thresholds.
- S1:DR synthesis: simultaneous supply expansion (issuance) and demand rationing (rates) as the proximate driver of realized volatility.
- Emin Yilmaz, remarks on the 90 Seconds program: deterioration of equity supply-demand balance as a potential trigger for puncturing the AI bubble. Paraphrased.
- S1:DR characterization of the AI capital stack: venture, private credit, and public equity as sequential underwriters.
- Inference from FN12 and FN15: failure of private financing channels and the stress test of public appetite.
- Historical analysis of technology cycle terminations, financing withdrawal versus technological disappointment; S1:DR archive.
- Financial Times (electronic edition), data center construction delays, citing SynMax Vulcan Platform and IIR Energy, data as of April 9, 2026; rebroadcast on Japanese financial television, June 2026.
- SynMax Vulcan Platform and IIR Energy: construction status of announced U.S. data center capacity by delivery vintage. Approximately 40% of 2025-vintage capacity delayed beyond 90 days or not started; in excess of 60% for 2026; the substantial majority of 2027-vintage capacity not yet under construction.
- Bearish interpretation: announcement-to-groundbreaking gap as revealed preference of hyperscaler capital discipline.
- Constructive interpretation: gas turbine lead times, transformer shortages, transmission interconnection queues, and electrical labor scarcity as exogenous constraints, 2025–2026.
- S1:DR synthesis: delayed revenue recognition in AI infrastructure colliding with reduced equity market forgiveness.
- Literature on oil price shocks and decarbonization: substitution effects in transport electrification versus upstream reinvestment and energy-security responses.
- Import-dependence and energy security doctrine in Japan, Korea, and the European Union following the Hormuz operation, Q2 2026.
- U.S. utility commentary, 2025–2026: AI load growth as the demand anchor for nuclear restarts, SMR pipelines (see S1:DR, “The Global SMR Landscape: BWRX-300 and Its Rivals,” 2026), storage, and incremental gas-fired capacity.
- S1:DR analysis: cancellation risk hierarchy among generation projects under a demand shortfall scenario; gas peakers as marginal casualties.
- S1:DR synthesis: the dual effect of an AI demand retrenchment on grid stress and clean firm power financing.
- Military operations and greenhouse gas accounting: Scope 1 emissions of naval deployments and conflict-related methane releases; academic literature on the carbon costs of armed conflict.
- Hinoeuma (丙午), the Fire Horse year of the sexagenary cycle; the 1966 Japanese birth rate decline of roughly 25% as documented demographic evidence of the superstition’s force.
- Folkloric attributes of the Fire Horse; S1:DR editorial license.
- Inference from FN7–FN9: renewed defense equity strength as a market judgment on conflict persistence.
- Inference from FN12, FN21–FN22: structural change in AI financing and delivery timelines.
- S1:DR house view, H2 2026 outlook: elevated realized and implied volatility as base case.