


Photo by Lalit Kumar on Unsplash. This article includes AI‑generated content. It does not constitute investment advice, nor does it imply any forecast or recommendation. All decisions should be based on independently verified data and the reader’s own judgment and professional expertise.
“History doesn’t repeat itself, but it often rhymes.” — Mark Twain
History has a weakness for rhyme, and rarely indulged it more openly than in the closing weeks of 1989. On 9 November the Berlin Wall came down, and with it the architecture of a forty-year standoff.FN1 Seven weeks later, on 29 December, the Nikkei 225 settled at 38,915.87, a number it would not look upon again for thirty-four years.FN2 One Cold War ended; one bull market expired. The coincidence was not quite a coincidence.
The conventional obituary for Japan’s bubble cites monetary tightening, a hallucinated property market, and demographics with the patience of a glacier. All true, and all incomplete. The deeper story is geographic. The peace that broke out in Europe also opened a continent of labour to the east, and the factory floor that had made Japan the second economy on Earth discovered it could be rebuilt elsewhere for a fraction of the wage bill.
FIG. 1 NIKKEI 225, YEAR-END CLOSE (1986-June 2026)
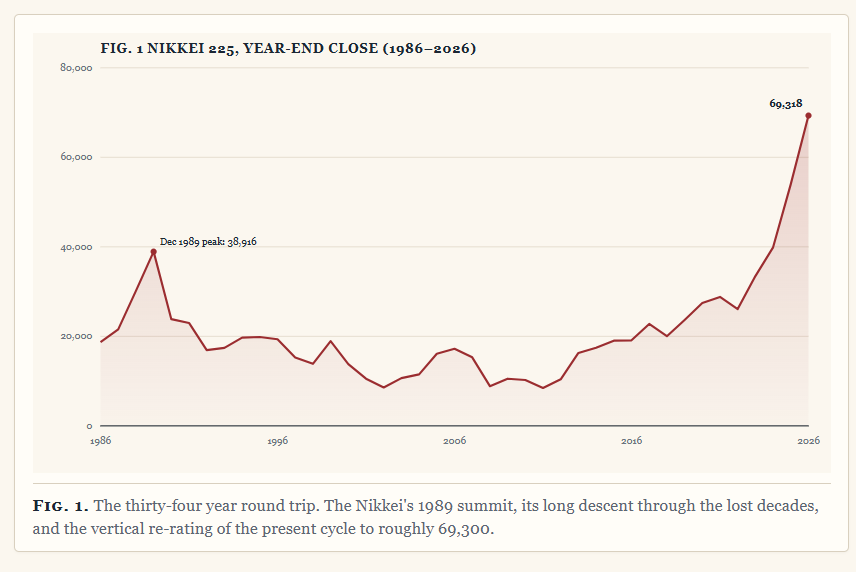
Notes: This chart includes AI‑generated elements and schematic redrawing for illustrative purposes. The chart was created as of June 15, 2026. All quantitative references should be verified against the original source data published by the Nikkei. The figure does not constitute investment advice, and no forecast or recommendation is implied. Any investment or strategic decision should rely on independently validated data and individual judgment. The thirty-four year round trip. The Nikkei’s 1989 summit, its long descent through the lost decades, and the vertical re-rating of the present cycle to roughly 69,300.
The Great Migration
Capital, like water, runs downhill toward cost. Through the 1990s the assembly of the modern world began its quiet exodus from Osaka and Nagoya toward the Pearl River Delta. The migration acquired legal blessing on 11 December 2001, when China formally acceded to the World Trade Organization and the phrase “the world’s factory” hardened from metaphor into accounting identity.FN3 What followed was the largest industrialisation in recorded history, and the equity market took the hint.
The Shanghai Composite, a sleepy bourse of a few hundred points at the decade’s open, vaulted to an intraday high of 6,124 on 16 October 2007 before the financial crisis intervened.FN4 The crash was violent, the recovery uneven, yet the secular line never broke: a market underwritten by the relocation of global production simply had more fuel than a market that had lost it.
FIG. 2 SHANGHAI COMPOSITE, YEAR-END CLOSE (1991–June 2026)
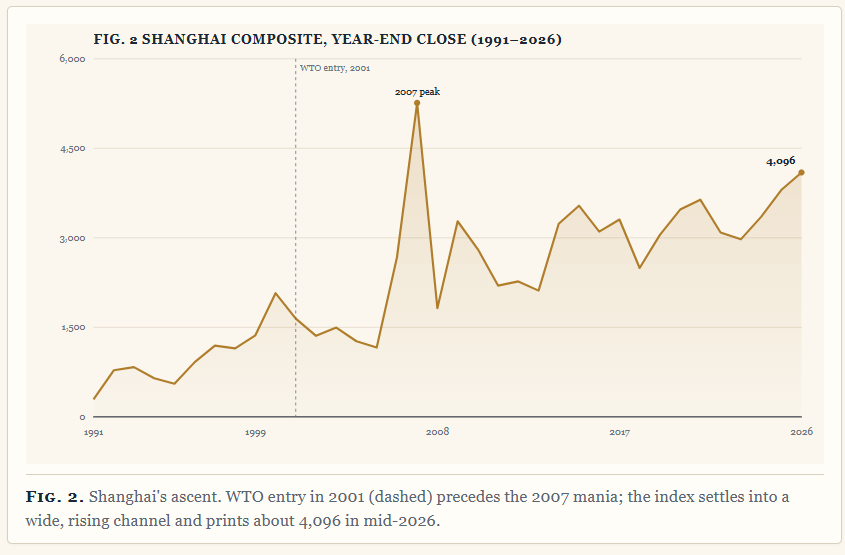
Notes: This chart includes AI‑generated elements and schematic redrawing for illustrative purposes. The chart was created as of June 15, 2026. All quantitative references should be verified against the original source data published by the Shanghai Stock Exchange. The figure does not constitute investment advice, and no forecast or recommendation is implied. Any investment or strategic decision should rely on independently validated data and individual judgment. Shanghai’s ascent. WTO entry in 2001 (dashed) precedes the 2007 mania; the index settles into a wide, rising channel and prints about 4,096 in mid-2026.
The factory that left Tokyo in 1990 spent a generation building the Shanghai Composite. The question now is whether it has packed its bags again.
The Convergence Scare
By the 2010s the trajectory looked less like growth than destiny. The IMF and the OECD, institutions not given to theatre, began modelling the year in which Chinese output would surpass American, a milestone already reached on a purchasing-power basis and merely a matter of arithmetic in nominal terms.FN5 Convergence, the comfortable consensus held, was no longer a forecast but a schedule. Consensus, as ever, was the tell.
The Decoupling
The schedule met its first serious objection in 2018, when the administration that had taken office the prior year opened a tariff campaign under Section 301 and turned trade into an instrument of statecraft.FN6 What looked at first like a single president’s idiosyncrasy proved to be a structural reappraisal. The succeeding administration retained the tariffs and sharpened the edges, adding sweeping export controls on advanced semiconductors and the tools that make them.FN7 Continuity, not reversal, was the message.
The second Trump term has escalated the contest into something resembling economic ordnance. Rare earths and their processing, leading-edge chips, and even crude are now traded as leverage rather than mere commodities, each side probing the other’s chokepoints while the diplomatic register stays studiously cordial.FN8 It is a negotiation conducted with a smile and a stranglehold: ostensibly friendly, unmistakably strategic. The defining feature of this new cold war is not the tariff schedule but the verb it has popularised, “to decouple,” and its gentler cousin, “to friend-shore.”
The Homecoming
Here the geography begins to run in reverse. A supply chain that prizes resilience over the last basis point of cost looks again at a country with deep capital markets, an alliance in good standing, world-class precision manufacturing, and a currency that has spent years on sale. Japan, in short. The semiconductor cluster forming in Kyushu, the reshoring of materials and equipment production, and the quiet repatriation of mandates long parked offshore all point the same direction. The factory that left Tokyo in 1990 is, at the margin, booking a return ticket.
The tape has noticed. The Nikkei reclaimed its 1989 high in February 2024, exorcising a ghost that had haunted a generation of strategists, and then refused to stop.FN9 By mid-June 2026 it printed 69,317.50, while the Shanghai Composite, for all China’s enduring scale, had drifted to 4,096.47.FN10 Rebased to a common start, the divergence and its recent inflection are difficult to unsee.
FIG. 3 REBASED COMPARISON (1991 = 100, LOG SCALE)
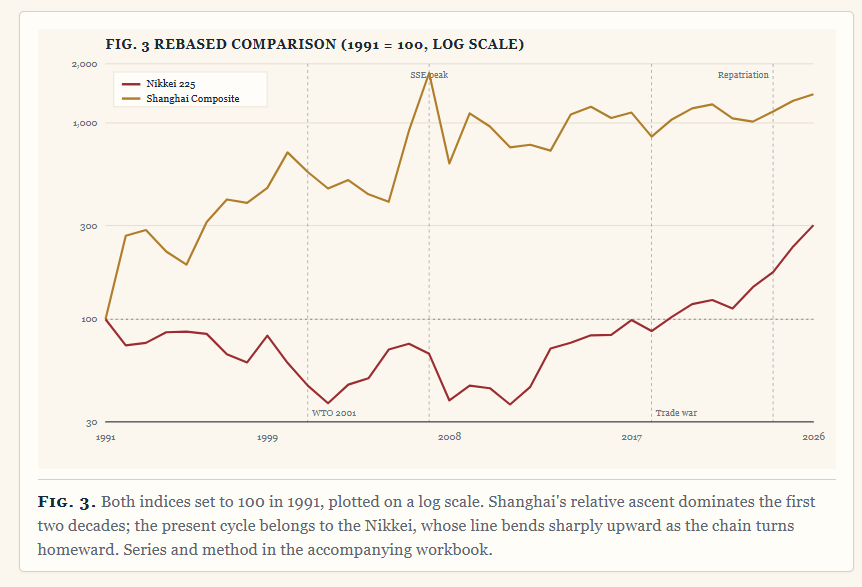
Notes: This chart includes AI‑generated elements and schematic redrawing for illustrative purposes. All quantitative references should be verified against the original source data published by the Nikkei and the Shanghai Stock Exchange. The figure does not constitute investment advice, and no forecast or recommendation is implied. Any investment or strategic decision should rely on independently validated data and individual judgment. Both indices set to 100 in 1991, plotted on a log scale. Shanghai’s relative ascent dominates the first two decades; the present cycle belongs to the Nikkei, whose line bends sharply upward as the chain turns homeward. Series and method in the accompanying workbook.
The Bottom
Investing folklore offers one durable truth and one cruel corollary. The truth: the richest returns accrue to capital deployed at the low. The corollary: the low is legible only in hindsight, by which time the bargain has expired.FN11 A market makes its bottom in the dark and its top in the headlines, and the headlines, at last, have arrived for Tokyo.
So consider the unfashionable possibility that the generational low was the long Nikkei trough of 2009 to 2012, when the index loitered near 8,000 and Japan was a synonym for stagnation. The flows now entering, foreign allocators rotating in, domestic savers nudged out of cash by reform and inflation, passive money obeying a rising index, behave less like latecomers chasing a top than like capital arriving a few years after a bottom it never recognised at the time. That is, historically, the most lucrative seat in the house, and the most uncomfortable one to occupy.
A forecast, then, with the humility the subject demands. If the supply-chain reversal is structural rather than cyclical, and the contours of the new cold war suggest it is, the Nikkei’s re-rating is an early chapter rather than a final one, punctuated by the sharp corrections that always accompany crowded conviction. The wall that fell in 1989 set the factory walking east. Its return journey is now visible on the tape, and the tape, for once, may be early rather than late.
The road we have known. The road that waits ahead.
Endnotes
- FN1. The Berlin Wall was opened on 9 November 1989, conventionally dated as the symbolic end of the Cold War in Europe. ↩
- FN2. Nikkei 225 closing high of 38,915.87 on 29 December 1989 (Tokyo Stock Exchange). ↩
- FN3. China acceded to the World Trade Organization on 11 December 2001. ↩
- FN4. Shanghai Composite intraday peak of 6,124.04 on 16 October 2007; the figure was not revisited in the years that followed. ↩
- FN5. IMF and OECD long-run projections. China surpassed the United States on a purchasing-power-parity basis in the mid-2010s; nominal-GDP crossover estimates vary by institution and assumption. ↩
- FN6. The first Trump administration took office in January 2017; its Section 301 tariff actions against China began in 2018. ↩
- FN7. The Biden administration retained the inherited tariffs and added export controls on advanced semiconductors and manufacturing equipment (notably October 2022), with further measures thereafter. ↩
- FN8. China has deployed export controls on gallium and germanium (2023) and on rare-earth processing know-how; both sides treat critical inputs, leading-edge chips, and energy flows as instruments of leverage. ↩
- FN9. The Nikkei 225 surpassed its 1989 closing high in February 2024 for the first time in more than thirty-four years. ↩
- FN10. Index levels as of 15 June 2026: Nikkei 225 = 69,317.50; Shanghai Composite = 4,096.47 (source: Yahoo Finance index pages, user screenshot). Full year-end series and rebased calculations are provided in the accompanying Excel workbook; 1986–2024 levels are historical year-end approximations and 2025 is a current-cycle estimate. ↩
- FN11. The proposition that returns are maximised by purchase at the trough is arithmetically trivial and operationally near-impossible; identification of a low is reliable only ex post. This note is analysis, not investment advice. ↩