

Photo by Vova Kondriianenko on Unsplash
The relationship between corporate climate commitment and market valuation has long been contested — often dismissed as correlation masquerading as causation, or as an artefact of sector composition rather than a signal about firms themselves. The data from Japan’s Nikkei 225, analysed here for the first time as a cross-sectional study, complicates that dismissal considerably.
Among the 225 constituents of Japan’s benchmark equity index, 95 companies — 42% of the index — hold SBTi-approved targets or formal commitments. The remaining 130 have not. Within that cohort, 42 companies have set net-zero targets, and 12 specifically carry SBTi-approved NZ targets with deadlines in the 2040s. The valuation gap between these two cohorts is not marginal: it is systematic, consistent across every major metric, and largest precisely where one would expect it to be if the market is pricing long-term business model resilience rather than short-term ESG signalling.
SBTi Adoption Across the Nikkei 225: Who Has Committed, and Why It Matters
The Science Based Targets initiative requires companies to set GHG reduction targets consistent with the 1.5°C pathway established under the Paris Agreement. For near-term targets, this means absolute reductions of approximately 42–50% by 2030 from a 2020 base. For net-zero targets — approved under the SBTi Corporate Net-Zero Standard — companies must demonstrate a 90%+ value-chain reduction by no later than 2050, with residual emissions neutralised by carbon removal. These are not aspirational pledges. They are independently validated commitments with specific quantitative requirements.
The Nikkei 225, as Japan’s most-watched equity index, provides a natural laboratory for examining whether this level of commitment registers in market pricing — and, if so, where within the industrial economy it is concentrated.
Share of Nikkei 225 constituents with SBTi-approved targets or formal commitments, by sector
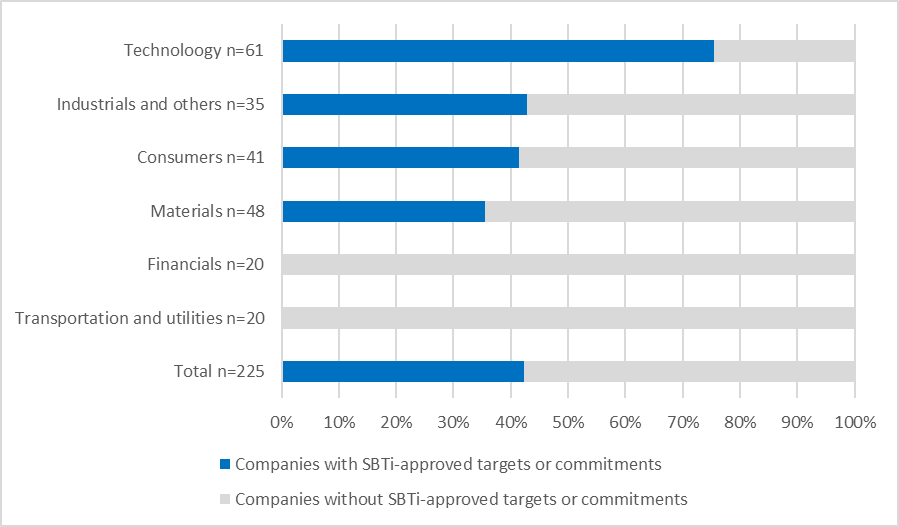
Source: SBTi database, S1:DR analysis as of May 24, 2026.
The Technology sector leads at approximately 75% — three in four companies having made formal SBTi commitments. This is not coincidental. Technology firms are disproportionately subject to international supply chain scrutiny, exposed to EU regulatory requirements (CSRD, CBAM), and dependent on institutional investor capital flows that increasingly screen for climate governance. The logic of SBTi adoption, in the Technology sector, is as much commercial as it is environmental.
At the opposite extreme, Financials and Transportation & Utilities register near-zero adoption — 5% and 3% respectively. For financial institutions, this reflects the methodological complexity of financed-emissions accounting; for transport and utilities, the capital intensity of decarbonization and the role of public regulatory frameworks in substituting for voluntary targets. Both sectors represent substantial engagement opportunities for institutional investors with cross-sector mandates.
The overall 42% adoption rate across the Nikkei 225 — just under half the index — nonetheless leaves 130 companies, including entire sectors such as Financials and Transportation & Utilities, without any science-based climate commitment. Within the committed cohort, the further distinction between near-term targets (the majority) and the 42 companies with net-zero targets — of which only 12 have SBTi-approved NZ targets with 2040s deadlines — reveals a steep ambition gradient even among those who have acted. Given that the SBTi’s near-term requirements are designed to be achievable within current technological and economic boundaries, this gap is a governance issue as much as a climate one.
The Valuation Premium: PER, PBR, Dividend Yield, Market Cap
The central empirical finding of this analysis is straightforward and merits direct statement: across every major valuation metric, SBTi-committed companies in the Nikkei 225 trade at a significant and consistent premium over non-committed peers.
Valuation Differences Between SBTi-Aligned and Non‑Aligned Companies in the Nikkei 225
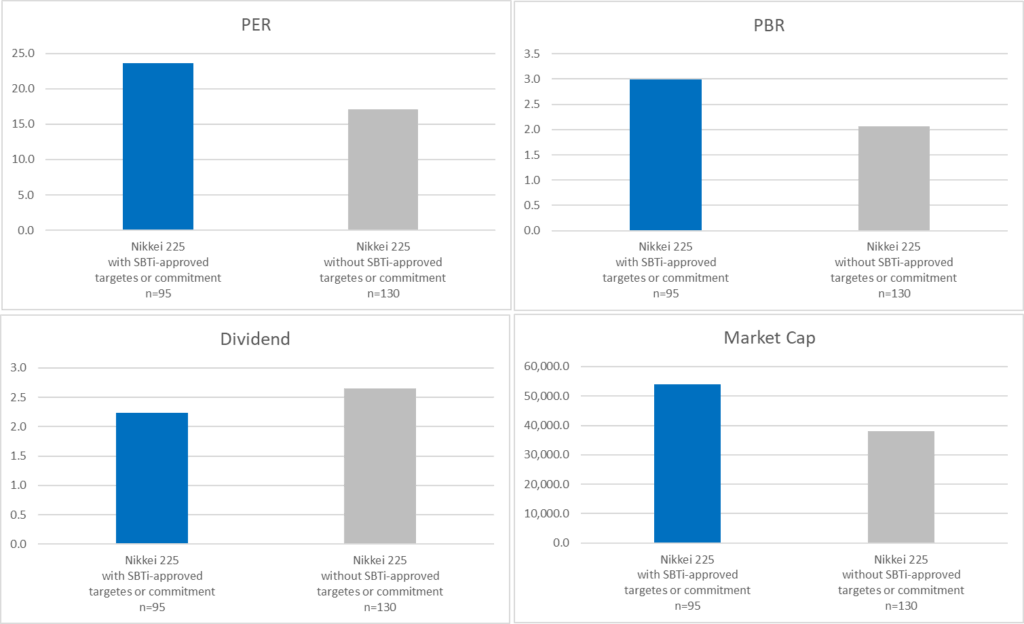
Source: Nikkei, S1:DR analysis as of May 24, 2026.
The PER and PBR differentials — 41% and 50% respectively — are large by any standard of cross-sectional analysis. The market capitalisation gap reflects size effects partly, but the PBR figure is size-adjusted by construction, making the 50% premium the more analytically important datum: investors are paying, on average, one full book-value turn more for companies that have made science-based climate commitments.
The most analytically interesting finding, however, is the dividend yield inversion. SBTi-committed companies distribute less cash — 2.2% versus 2.7% for non-committed peers. This is not a sign of financial underperformance. It is, rather, a deliberate signal of where capital is being directed. Companies that have committed to 40–90% emissions reductions across their value chains over the next 15–20 years are allocating retained earnings toward the R&D, capital expenditure, supplier engagement programmes, and operational transformation required to execute those commitments. The market, in pricing those companies at a premium despite lower near-term cash yield, is making a judgment: the reinvestment is more valuable than the distribution.[FN12]
That judgment is not self-evident. It implies a belief in the durability of the returns on climate-aligned reinvestment — in reduced future energy costs, in access to regulated markets that will require low-carbon supply chains, in the long-term brand and regulatory advantages of early commitment. It is, in the language of corporate finance, a growth premium. And it raises an immediate question: is it justified?
Finding — The Reinvestment Thesis
The dividend yield inversion in the Nikkei 225 SBTi data is the most structurally significant finding in this analysis. It suggests that the market is pricing SBTi-committed companies not as ESG-screened allocations but as long-duration growth assets — companies whose current underperformance on near-term cash yield is offset by an expectation of superior capital deployment over a 15–20 year horizon. For institutional investors, this has two implications: first, that SBTi commitment is becoming a proxy for capital allocation quality; and second, that companies that fail to convert that commitment into demonstrated operational progress will face re-rating risk as the time horizon of assessment shortens.
The Individual-Company Map: Where the Premium Concentrates
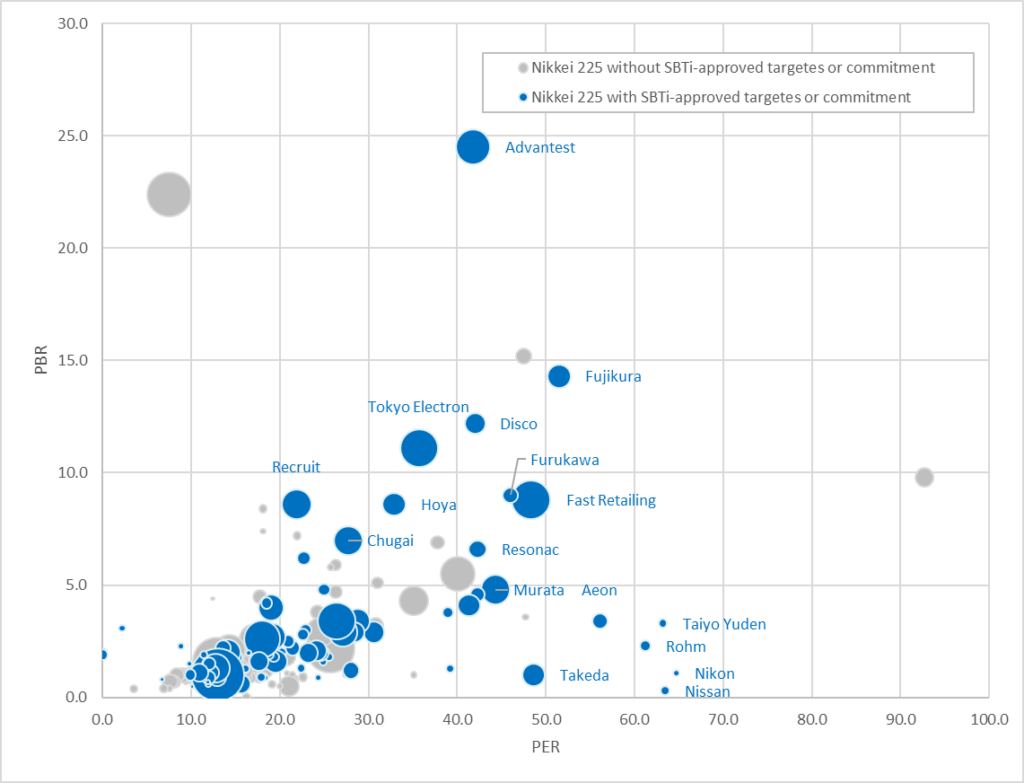
Source: Nikkei, S1:DR analysis as of May 24, 2026.
The scatter chart translates the aggregate finding into individual names and makes explicit what the averages can only imply. The upper-right quadrant of the PER/PBR space — high earnings multiple, high book-value multiple — is dominated almost entirely by SBTi-committed companies (blue dots). Advantest anchors the extreme at PBR ~25×, flanked by Tokyo Electron, Disco, Recruit, Hoya, Fujikura, and Fast Retailing — all blue, all representing sectors with high R&D intensity, international revenue exposure, and governance quality.
The grey cluster — non-SBTi companies — is concentrated in the lower-left: lower PER, lower PBR, smaller market capitalisation. There are grey outliers at elevated PBR, but they are rare and structurally distinct (concentrated in specific subsectors where scarcity of supply drives valuation rather than business-model quality).
What this chart does not show — but what the engagement framework demands — is whether the blue dots are earning their premium. High valuation is a claim on future performance. For SBTi-committed companies, that claim rests on a specific operational bet: that the capital being reinvested instead of distributed as dividends will, in fact, reduce emissions on the promised trajectory and translate into durable competitive advantage. That is the question that investor engagement must now hold companies accountable to answer.
There is a macroeconomic dimension to this premium that the Japanese market context makes impossible to ignore. Japan imports approximately 95% of its primary energy demand, priced in US dollars, and the past four years have delivered two successive reminders of what that dependency costs. The first came in 2022, when Russia’s invasion of Ukraine sent global LNG prices surging and — compounded by a yen weakening toward multi-decade lows approaching ¥160 to the dollar — drove Japan’s fossil fuel import bill up by more than ¥22 trillion over two years, producing the country’s largest-ever trade deficit and pushing electricity prices to a record ¥20.41 per kilowatt-hour.[FN13],[FN14] The second, more acute, shock arrived in February 2026: the US-Israeli military strikes on Iran triggered retaliatory closures of the Strait of Hormuz — the transit point for roughly 20% of global oil and LNG supply — sending Asian LNG spot prices up more than 140% and driving Brent crude toward $115 per barrel in stress scenarios, while the yen again weakened past ¥158 to the dollar under the combined pressure of energy import costs and safe-haven dollar demand.[FN16],[FN17] Japan relies on the Middle East for approximately 90% of its crude oil imports, the overwhelming majority of which transits Hormuz; the conflict has directly strained an economy already under pressure from inflation, high prices, and structurally weak real wages. The Japanese government’s ¥10 trillion in retail energy subsidies since 2023 provided temporary relief but addressed none of the underlying structural exposure — and cannot be sustained indefinitely.[FN15]
This is where the SBTi valuation premium acquires its most concrete economic logic. A company actively reducing its fossil fuel dependence — through energy efficiency investment, renewable energy procurement, and supply chain decarbonization — is simultaneously building a hedge against the yen-amplified cost of imported energy. The dividend yield inversion identified in the Nikkei 225 data almost certainly reflects, in part, exactly this capital allocation dynamic: reinvestment in energy transition infrastructure that locks in cost savings against a structurally expensive and volatile energy backdrop. The economics have crossed a critical threshold: since 2010, solar PV costs have fallen 90% globally and onshore wind 70%, such that in 2023, 81% of newly commissioned renewable projects were already more cost-effective than fossil-fired alternatives.[FN14] For Japanese manufacturers with the scale to enter long-term power purchase agreements, decarbonization and cost reduction have become, increasingly, the same decision — and the PBR premium separating SBTi-committed companies from their non-committed peers may, in material part, be the market’s recognition of precisely that convergence.
Sony Group and the Anatomy of a Net-Zero Commitment
Sony Group Corporation is one of only 12 companies in the Nikkei 225 with an SBTi-approved net-zero target set for the 2040s — a subset of the 42 companies with NZ targets, within a broader cohort of 95 companies holding any form of SBTi approval or commitment.
Sony’s emissions are overwhelmingly concentrated in Scope 3: use of sold products (Cat 11, ~60% of total Scope 3), purchased goods and services (Cat 1), and capital goods (Cat 2). The central challenge is not ambition — it is execution across a value chain that Sony does not directly control.
Sony’s Climate Commitments at a Glance: Targets, Timelines, and Value‑Chain Exposure
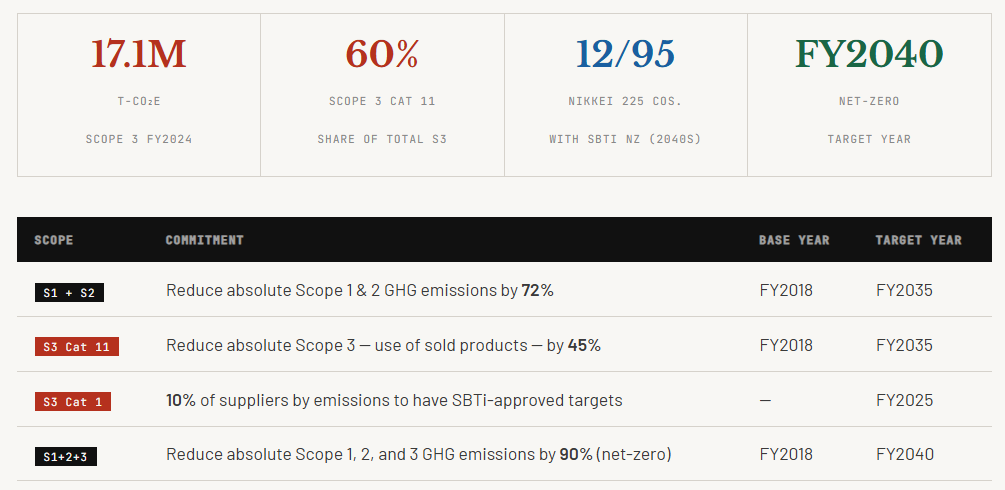
Source: SBTi database, S1:DR analysis as of May 24, 2026.
In August 2025, Sony formalised its “Green Management 2030” (GM2030) medium-term framework, committing to a 60% reduction in Scope 1 and 2 emissions versus FY2025 levels, a 25% reduction in total Scope 3, and 100% renewable electricity across its own operations — all by FY2030.[FN1] The framework represents a measurable step-up from GM2025 and is explicitly designed to cascade into the supply chain: major raw material and component suppliers are asked to commit to 100% renewable electricity for Sony-related production.
The Emissions Architecture: Where the Exposure Lies
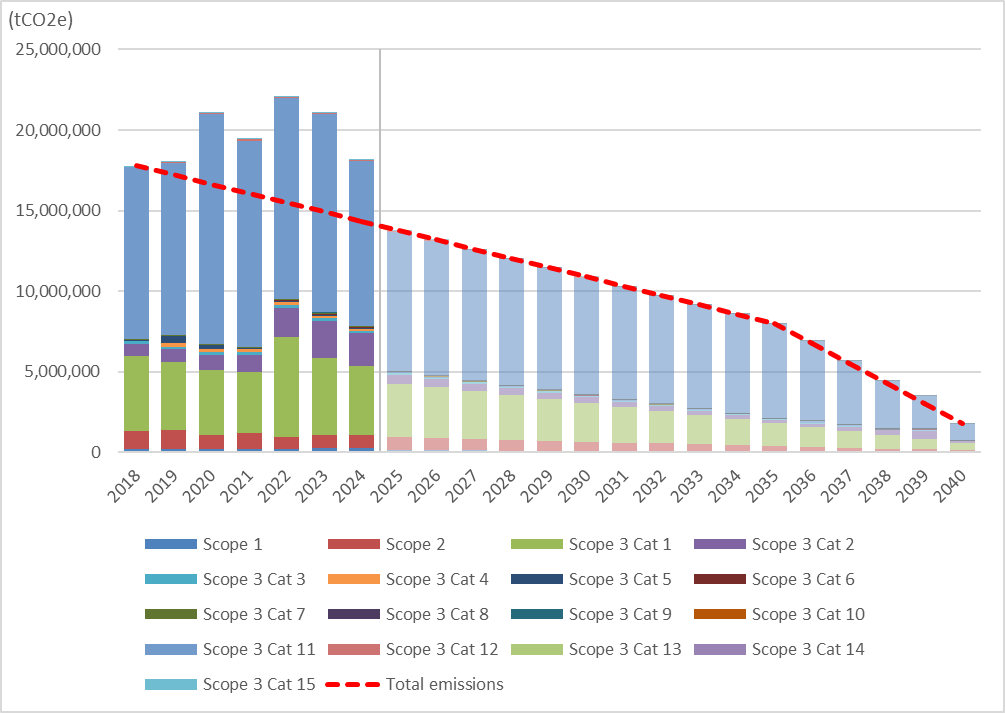
Sony Group total GHG emissions by scope (FY2018–FY2040). Red dashed line = SBTi-aligned near-term target and net-zero trajectory (90% reduction from FY2018 by FY2040). Note the visible growth in the upper emission bands from 2022 — attributable to Cat 1 and Cat 2. Source: Sony Group Sustainability Report 2025; S1:DR analysis.
Sony’s total Scope 3 emissions reached approximately 17.1 million t-CO₂e in FY2024, down from a peak of roughly 22 million t-CO₂e in FY2022 but still meaningfully above the FY2018 baseline from which the 90% net-zero reduction is measured.[FN2] Scope 1 stood at approximately 235,000 t-CO₂e and Scope 2 (market-based) at approximately 810,000 t-CO₂e — reflecting genuine operational-level progress on renewable energy procurement. The challenge, as is typical for a consumer electronics manufacturer, is not in the operations: it is in the value chain above and below them.
The chart reveals two distinct dynamics unfolding simultaneously. In the lower emission bands — Scope 1, Scope 2 — there is a clear downward trend consistent with the SBTi trajectory. In the upper bands — Scope 3 Cat 1 and Cat 2 — there is growth since approximately 2022, likely driven by the capital investment cycle associated with new product platforms, semiconductor supply chain expansion, and increased manufacturing volumes. These two movements are, for now, partially offsetting. Under the net-zero constraint, they cannot continue to do so.
Scope 3 Cat 11: The Encouraging Arc, and the Gaming Wildcard
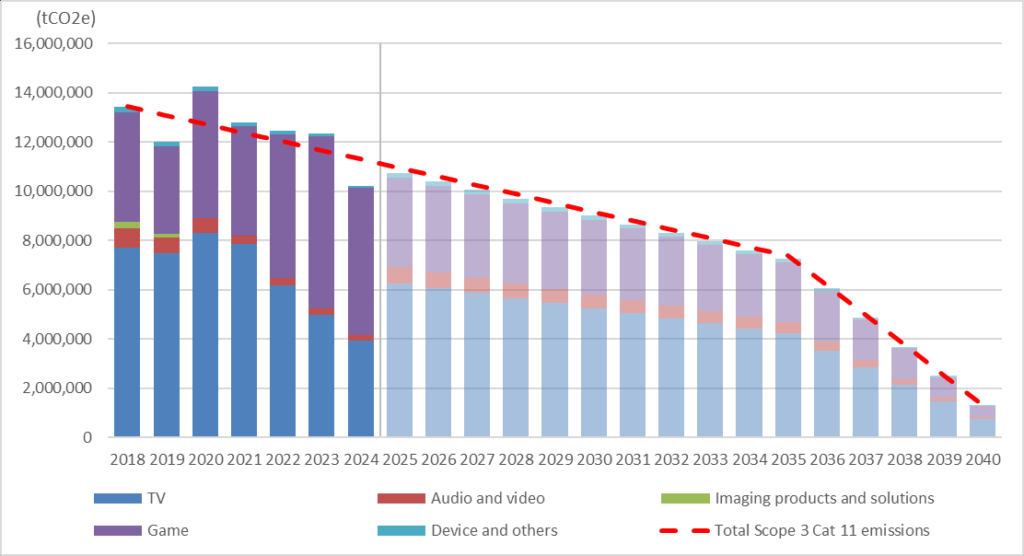
Scope 3 Cat 11 (use of sold products) by product category. TV, audio/video, and imaging show steep decline; gaming emissions are elevated and persistent. Red dashed = 45% reduction trajectory to FY2035. Source: Sony Group Sustainability Report 2025; S1:DR analysis.
The chart contains genuinely good news for Sony’s net-zero case, and it warrants being stated clearly before the complications are addressed. Emissions from televisions, audio and video products, and imaging solutions have declined substantially since 2018 — in several categories, the trajectory already approximates the 45% reduction target for FY2035. The forces driving this are structural: successive hardware generations have achieved meaningful improvements in power efficiency, consumer electricity consumption per device has fallen, and Sony’s imaging and audio portfolio has shifted toward smaller, more efficient form factors.
Sony’s PS5 — launched in FY2020 — consumed approximately 11–17% less energy than the launch model of the PS4, despite higher computational performance requirements. The design improvements included AMD Zen 2/RDNA 2 chipset architecture, solid-state drive efficiency gains, and deeper rest-mode power management — together estimated to avoid approximately 46,000 t-CO₂e per year per million consoles sold.[FN3] The scheduled discontinuation of Sony’s Blu-ray disc product line in 2026 will remove a further source of downstream product-use emissions. Sony Interactive Entertainment has set an interim target of a 13% reduction in GHG emissions per product sold by FY2030.[FN4]
The problem, visible in the chart, is gaming. PlayStation console emissions — encompassing hardware use, network infrastructure, streaming services, and game distribution — are structurally elevated and show less pronounced decline than other product categories. Sony Interactive Entertainment is candid about the constraint: “further opportunities to reduce PS5 power consumption are limited due to technological constraints.”[FN5] The company’s response has combined engineering measures — adaptive charging, a “Power Saver for games” mode — with demand-side interventions such as the CleanPlay application, launched on PS5 in early 2025, which enables players to link gaming sessions with investment in renewable energy projects.[FN6]
CleanPlay is an innovation. It is also, structurally, an offset mechanism rather than an emission reduction. The distinction matters for net-zero accounting. Rising global gaming engagement, increasing graphical fidelity requirements, and the energy intensity of cloud gaming infrastructure represent a structural headwind that product-efficiency improvements in televisions and audio products cannot fully compensate for. Sony’s Cat 11 trajectory, in aggregate, may remain on target — but the composition of that target is shifting in ways that carry execution risk and deserve explicit management commentary.
The Supply Chain Problem: Cat 1, Cat 2, and the Limits of Upstream Influence
If Cat 11 is the encouraging story with a complication, Cat 1 and Cat 2 are the complication without much encouraging story — at least not yet. The left-hand chart shows that since approximately 2022, Sony’s upstream Scope 3 emissions have been growing, not falling. This matters disproportionately because the net-zero trajectory is a total value-chain constraint: every tonne of Cat 1 or Cat 2 growth must be compensated by additional reduction elsewhere within the same 90% envelope.
Cat 1 — purchased goods and services — primarily captures the emissions embedded in the semiconductors, precision components, rare materials, and sub-assemblies that Sony sources from thousands of suppliers globally. Cat 2 — capital goods — reflects the emissions associated with manufacturing equipment, facilities investment, and the physical infrastructure of the supply chain. Neither is under Sony’s operational control. Both are, therefore, among the hardest categories to reduce.
“The most structurally difficult dimension of Sony’s decarbonisation commitment is not the product-use trajectory — which is measurable, largely within the product design envelope, and showing genuine progress. It is the upstream value chain: a landscape of thousands of suppliers across multiple tiers, many of them small or medium-sized enterprises in Japan, Southeast Asia, and Taiwan, for whom the economics of rapid decarbonisation are genuinely challenging.”S1:DR Analysis
The 10% Supplier Target: Necessary But Not Sufficient
Sony’s SBTi-approved Cat 1 target requires that 10% of its suppliers by emissions — covering purchased goods and services — will have SBTi-approved targets by FY2025.[FN7] This is the minimum formulation permitted under the SBTi Corporate Net-Zero Standard for supplier engagement. It is not a particularly ambitious threshold: 10% by emissions means, in practice, engaging the largest emitters in the supply base while leaving the long tail unaddressed.
Sony has embedded supplier requirements across multiple frameworks. Its Supply Chain Code of Conduct requires suppliers to track Scopes 1, 2, and key Scope 3 emissions and seek energy efficiency improvements.[FN9] GM2025 and GM2030 escalate these expectations: suppliers are asked to set medium- and long-term GHG targets, manage progress against them, and — under GM2030 — commit to 100% renewable electricity for Sony-related production.[FN8]
What is absent from Sony’s public reporting is granular disclosure of progress against the FY2025 target. No quantitative data on the percentage of Cat 1 emissions covered by suppliers with SBTi-approved targets has been identified in the company’s FY2024 sustainability disclosures. This absence is itself a material disclosure gap: the FY2025 deadline has passed, and investors have no independent basis for assessing whether the commitment has been met. Peer companies with more ambitious supplier engagement frameworks — Apple, for instance, targets full supply chain carbon neutrality by 2030 and publishes annual progress metrics — provide a useful comparative benchmark.
What Else Can Move Cat 1 and Cat 2?
Beyond target-setting and supplier capability programmes, there are four structural levers available to Sony for reducing upstream emissions. Each involves a different trade-off between effectiveness and commercial cost.
Procurement-integrated climate requirements. The most commercially significant lever is embedding GHG reduction performance into sourcing decisions — weighting supplier selection criteria on emissions intensity, incorporating carbon commitments into supply contracts, and linking pricing terms to decarbonisation milestones. This approach — used by a small number of global manufacturers including Schneider Electric and Siemens — creates direct financial consequences for supplier inaction rather than relying on exhortation. Sony’s current framework, which requests but does not mandate or incentivise, falls short of this standard.
Bill-of-materials decarbonization. The embedded emissions of a consumer electronics product are substantially determined at the design stage — by material selection, component sourcing geography, and manufacturing process requirements. GM2030’s commitments on recycled tin in solder and recycled gold in key components are indicative of this approach but narrow in scope. A systematic bill-of-materials carbon accounting methodology, integrated into product development processes, would extend this logic across the full portfolio.
Supplier energy transition financing. Many of Sony’s smaller suppliers face a genuine economic constraint: the capital required to install on-site renewable generation or procure green power contracts is not available at commercially viable rates, particularly for manufacturers in markets without developed renewable energy infrastructure. Sony could act as a facilitator — using its balance sheet strength and procurement relationships to structure green financing arrangements, virtual power purchase agreements, or collective procurement schemes that reduce the cost of renewable energy transition for key suppliers. This is increasingly common among large technology OEMs; Sony has not yet disclosed a structured programme of this kind.
Capital goods intensity (Cat 2). The Cat 2 growth since 2022 reflects, in part, the capital expenditure cycle associated with new product platforms and semiconductor manufacturing investment. Sony has not publicly disclosed whether a shadow carbon price is applied to capital investment appraisal decisions, nor whether Cat 2 reduction targets have been incorporated into the net-zero scenario. Given that Cat 2 emissions are driven by choices made at the capital budgeting stage, the absence of a carbon-adjusted CAPEX framework represents a governance gap.
Structural Risk — Upstream Emissions Growth
The visible growth in Sony’s Cat 1 and Cat 2 emissions since FY2022 is not, in itself, disqualifying for the net-zero trajectory. But it creates a structural burden: every additional tonne of upstream emissions that accumulates above the FY2018 baseline narrows the margin for error in Cat 11 and Scope 1/2 reduction. If Cat 1 and Cat 2 continue to grow while Cat 11 reduction moderates — due, for instance, to gaming intensity — the combined pressure on the net-zero path becomes difficult to contain without step-change interventions. Investors should treat the Cat 1/Cat 2 trend as a leading indicator of net-zero delivery risk, not a lagging disclosure item.
Engagement Points — Supply Chain & Upstream Emissions
- FY2025 Cat 1 target disclosure: Quantify the percentage of Scope 3 Cat 1 emissions covered by suppliers with SBTi-approved targets as of FY2025. Report year-on-year progress and the methodology used to verify supplier claims.
- Cat 1/Cat 2 growth explanation: Provide category-level analysis of what drove the post-2022 increase in upstream emissions. Confirm that the net-zero trajectory has been stress-tested against continued structural supply chain growth.
- Procurement integration: Describe the mechanism by which supplier GHG performance influences sourcing decisions. Is emissions performance a weighted criterion in supplier selection? Are carbon reduction milestones embedded in supply contracts?
- Supplier financing: Does Sony have a programme to facilitate renewable energy financing for key suppliers that lack independent access to green capital? If not, why not, given the company’s balance sheet position and the scale of its Cat 1 exposure?
- Cat 2 shadow carbon pricing: Is a shadow carbon price applied to capital investment decisions? What is the quantified Cat 2 reduction pathway under the net-zero scenario?
The Dual Imperative: Decarbonisation and Commercial Competitiveness
The central tension in Sony’s net-zero commitment is not technical — it is strategic. The company is simultaneously committed to a 90% value-chain emission reduction by 2040 and to sustaining commercial leadership across gaming, consumer electronics, imaging, and entertainment: sectors in which competitive advantage is driven by product performance, manufacturing scale, and supply chain agility. The question is not whether these objectives conflict — they clearly do, in the short term — but whether they can be made to reinforce each other over the medium and long term.
Energy Cost as Commercial Lever
The most direct channel through which decarbonisation creates commercial value is energy cost reduction. Sony’s commitment to 100% renewable electricity in its own operations by FY2030, underwritten by RE100 membership and a growing portfolio of virtual power purchase agreements in Japan, Thailand, and the United States, is explicitly designed to insulate its manufacturing operations from fossil fuel price volatility while meeting Scope 2 targets.[FN10] For a manufacturer with significant power-intensive semiconductor imaging operations, locking in long-term renewable energy pricing is a hedge with identifiable economic value — a value that increases as carbon pricing mechanisms mature in key production markets.
The commercial evidence is beginning to accumulate. ESG-aligned product segments — Game and Network Services (+8% revenue growth Q1 2025) and Imaging and Sensing Solutions (+15%) — outperformed the broader Sony portfolio and industry peers in early FY2025.[FN11] Whether this correlation is causal — and if so, through what mechanism — is a question worth pressing. But the directional signal is consistent with the broader Nikkei 225 finding: capital allocation toward decarbonisation-aligned business transformation tends to concentrate in the segments generating the most durable revenue growth.
Product Efficiency as Differentiation
In markets where consumers bear electricity costs directly — and where those costs have remained elevated across Europe, Japan, and the US since 2022 — the energy efficiency of durable hardware is an increasingly salient purchasing criterion. Sony’s ability to position PS5 energy performance as a consumer proposition, and to embed power-saving features as product innovations rather than compromises, illustrates the potential of this channel. As next-generation gaming hardware develops, the competitive dynamic between Sony, Microsoft, and Nintendo will increasingly include efficiency as a dimension — a shift that favours the company that has integrated energy performance deepest into its engineering roadmap.
Supply Chain Decarbonisation as Strategic Moat
The most underappreciated commercial dimension of Sony’s upstream emission challenge is the regulatory trajectory. The EU’s Corporate Sustainability Reporting Directive will require large EU-market companies to disclose full value-chain emissions from FY2025 onward; the California Climate-Related Risk Act will mandate similar disclosures for companies operating in California. Both regimes are cascading requirements down through supply chains: Sony’s large OEM and enterprise customers in European and North American markets will increasingly need to quantify and report the emissions embedded in Sony’s products as part of their own compliance obligations.
A Sony with credible, verified, and declining Cat 1 emissions is a better supplier for those customers than a Sony without. Supplier decarbonisation is, in this reading, not simply an environmental commitment — it is a prerequisite for maintaining access to high-value commercial relationships as regulatory scope expands. The companies that build this capability early will face a lower incremental cost than those that build it under compliance pressure later.
“The companies that will sustain competitive advantage through the energy transition are not those that minimise climate investment — it is those that integrate it into product design, procurement strategy, capital allocation, and investor communication early enough that it becomes core capability rather than compliance overhead. For Sony, the question is whether the reinvestment that its SBTi commitment implies will be executed at the pace and depth that the net-zero trajectory demands.”S1:DR Analysis
Sony’s Position Within the Nikkei 225 SBTi Cohort
Sony trades at a PBR of approximately 2.2× — a mid-tier position within the Nikkei 225 SBTi cohort, well below the frontier names (Advantest, Tokyo Electron, Recruit) that trade at 8–25× book value. Its SBTi net-zero credentials — one of only 12 in the index — provide a structural basis for re-rating as sustainability-linked capital flows into the Japanese equity market continue to grow. The risk to that thesis is dual: operational, in the form of a failure to bend the Cat 1/Cat 2 trajectory; and disclosure, in the form of insufficient granularity on supplier engagement progress. Either failure would invite the market to question whether a net-zero commitment without visible execution is simply another form of long-duration optionality — valuable in principle, uncertain in practice.
Nikkei 225 Companies with SBTi‑Approved Net‑Zero Targets: Sector, Valuation, and Target Year Overview
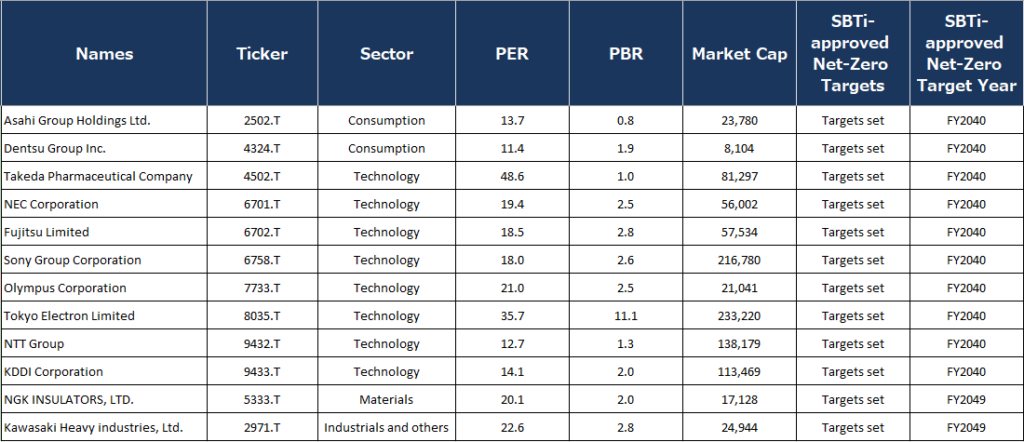
Source: Nikkei, S1:DR analysis as of May 24, 2026.
Investment Implication — Sony’s Re-Rating Thesis
Sony’s position as one of only 12 Nikkei 225 companies with SBTi-approved net-zero targets set for the 2040s creates a structural scarcity premium within an SBTi cohort of 95 — itself less than half the index. As ESG-mandated capital flows intensify in the Japanese equity market — driven by GPIF’s evolving ESG policy, the growth of global climate-themed funds, and increasing EU regulatory pressure on portfolio emissions — the pool of eligible Nikkei 225 investments for sustainability-mandated allocators is constrained. Sony is in that pool. The risk to re-rating is not external: it is the credibility of execution. Investors should engage on Cat 1 supplier disclosure, Cat 2 capital allocation, and the gaming emissions roadmap as the three most material near-term tests of whether Sony’s dual imperative — decarbonisation and commercial competitiveness — is being managed with the rigour the premium implies.
Conclusion: Can Sony Square the Circle?
The answer, on the evidence available in May 2026, is a qualified yes. Sony’s most commercially dynamic segments — Imaging & Sensing Solutions, Music, and Game & Network Services — are simultaneously its most strategically aligned with the decarbonisation agenda, and FY2025’s record sales of ¥12.48 trillion and operating income up 13% to ¥1.45 trillion demonstrate that the reinvestment premium embedded in its lower dividend yield is, at least so far, earning its returns.[FN18] The convergence of energy cost reduction and emissions reduction — rendered urgent by the 2022 Ukraine shock and the 2026 Iran crisis — means that Sony’s renewable energy transition, product efficiency gains, and GM2030 supplier requirements are simultaneously climate commitments and operating cost hedges: the dual imperative is, in its strongest dimensions, already the same decision. What remains unresolved — and where the distance between aspiration and execution is widest — is the gaming emissions roadmap and the upstream supply chain, where Cat 1 and Cat 2 emissions have grown since 2022 and where the FY2025 supplier SBTi coverage target has produced no public progress disclosure. The market, in pricing Sony at a PBR of approximately 2.2×, appears to have reached the same provisional judgment: credible, but not yet confirmed. The engagement questions below are the empirical tests that will determine whether Sony’s SBTi-approved net-zero target is a binding constraint on strategy — or an ambitious aspiration still awaiting the operational program that can make it real.
Summary Engagement Framework
Priority Engagement Questions — Sony Group Corporation
- Cat 1 FY2025 target outcome: Disclose the percentage of Scope 3 Cat 1 emissions covered by suppliers with SBTi-approved targets as of FY2025. If the 10% threshold has been met, what is the next target? If not, what is the remediation plan?
- Cat 1/Cat 2 growth drivers and revised trajectory: Provide a category-level explanation of post-2022 upstream emissions growth and a revised net-zero scenario incorporating continued supply chain expansion.
- Procurement integration of climate performance: Describe quantitatively how GHG reduction performance influences supplier selection, contract terms, and pricing. Is emissions performance a weighted procurement criterion?
- Gaming emissions roadmap: Publish a standalone roadmap for Game & Network Services segment emissions — covering hardware efficiency targets, data centre energy intensity, and streaming infrastructure — with annual quantitative disclosure.
- Cat 11 target ambition: Given non-gaming Cat 11 progress, can the 45%-by-FY2035 target be raised or brought forward to FY2030, consistent with GM2030’s 25% total Scope 3 reduction ambition?
- Capital allocation and shadow carbon pricing: Is a shadow carbon price applied to capital investment decisions? What is the explicit Cat 2 reduction pathway? How is decarbonisation embedded in the medium-term business plan and CAPEX framework?
References
[FN1] Sony Group Corporation, “Sony Establishes ‘Green Management 2030’ Group Medium-Term Environmental Targets,” Press Release, 29 August 2025.
[FN2] DitchCarbon, “Sony Emissions Breakdown & Climate Score,” FY2024 data. Sony Group Sustainability Report 2025.
[FN3] Sony Interactive Entertainment, “PlayStation 5 and its Energy Efficiency.”
[FN4] Sony Interactive Entertainment, “Environment — Targets and Progress.”
[FN5] Sony Interactive Entertainment, “Environment,” op. cit. See also: “Road to Zero: Our Commitment to Environmental Improvement,” Sony Interactive Entertainment, 2025.
[FN6] Sony Interactive Entertainment, “Enabling Environmental Action with the CleanPlay App on PlayStation 5,” March 2025.
[FN7] SBTi Corporate Net-Zero Standard; Sony Group SBTi Target Summary. ESG News, “Sony’s Net Zero Targets Approved by SBTi,” September 2022.
[FN8] The Climate Pledge, “For Sony protecting the environment is part of its DNA,” May 2024. Sony Group Corporation, GM2030 Press Release, op. cit.
[FN9] Greenplaces, “Sony Supplier Requirements,” citing Sony Supply Chain Code of Conduct.
[FN10] The Climate Pledge, op. cit.; RE100 initiative membership (Sony, 2018). Sony Group Sustainability Report 2025; Sony virtual PPA disclosures, Japan and Thailand operations.
[FN11] AInvest, “Sony’s Green Management 2030: A Strategic Leap Toward Net-Zero and Circular Economy Leadership,” 30 August 2025. Sony Group Corporation Q1 FY2025 earnings disclosure.
[FN12] S1:DR Quantitative Analysis, May 2026. Cross-sectional valuation study of Nikkei 225 constituents segmented by SBTi target status. PER, PBR, Dividend Yield, and Market Capitalisation sourced from Nikkei 225 dataset, May 2026. Sector classification per standard Nikkei 225 framework. Analysis controls for index composition but not sector-level valuation differences.
[FN13] Ministry of Economy, Trade and Industry (METI), Energy White Paper 2024, Cabinet Decision, June 2024. Japan’s fossil fuel import value increased by more than ¥22 trillion over two years due to fuel price hikes and yen depreciation, resulting in the country’s largest-ever trade deficit.
[FN14] IEEFA, “The clean energy transition is an economic imperative for Japan’s new government.” Japan’s average electricity price peaked at ¥20.41/kWh during the 2022 energy crisis; eased to ¥12.20/kWh but remains above pre-pandemic levels. In 2023, 81% of new global renewable projects were more cost-effective than fossil-fired alternatives; solar PV costs have fallen 90% and onshore wind 70% since 2010.
[FN15] Positive Money Global, “The unbearable cost of ‘Fossilflation’ — why Japan needs clean, green energy,” November 2024. Japan spent approximately ¥10 trillion on retail energy subsidies since 2023; 84.8% of total energy supply is fossil-based; ~95% of primary energy is imported. See also IEEFA, “Japan’s persistent fossil fuel subsidies threaten industry competitiveness,” September 2024.
[FN16] CSIS, “What Are the Implications of the Iran Conflict for Japan?”, May 2026. The US–Israeli attack on Iran on 28 February 2026 triggered effective closure of the Strait of Hormuz; Japan relies on the Middle East for ~90% of crude oil imports. LNG spot prices in Asia rose over 140%. See also CNBC, “Iran war-hit oil prices will soon rise if Hormuz stays shut,” March 2026.
[FN17] World Bank, Commodity Markets Outlook, April 2026. Brent oil prices could average as high as $115/barrel in a prolonged disruption scenario. World Economic Forum, “The global price tag of war in the Middle East,” March 2026 — higher energy costs feed directly into electronics production costs, squeezing margins. Trading Economics, “Yen Weakens as Iran War Weighs,” March 2026.
[FN18] Sony Group Corporation, FY2025 Full-Year Consolidated Financial Results (fiscal year ended March 31, 2026), announced May 2026. Record full-year sales ¥12,479.6 billion (+3.7% YoY), operating income ¥1,447.5 billion (+13.4% YoY) from continuing operations. Record profits in Games & Network Services, Music, and Imaging & Sensing Solutions; PlayStation 5 cumulative sales topped 93 million units; monthly active users record 125 million. Non-binding MOU with TSMC for next-generation image sensor JV announced.