

Photo by JC3211 on Unsplash
The finalized 2024 emissions inventory confirms what the maps already show — Japan’s household carbon footprint is overwhelmingly a metropolitan problem.
In April 2026, the National Institute for Environmental Studies (NIES) released the finalised national greenhouse gas emissions inventory for fiscal year 2024, providing the most complete picture yet of where Japan’s residential CO₂ originates at a sub-district level.FN1
CO₂ Emissions from Residential Sectors by Region (2024)
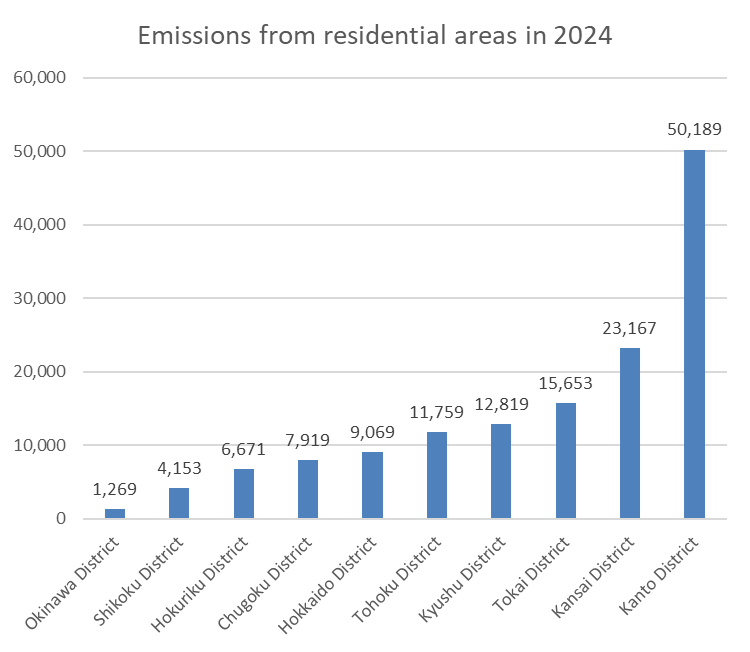
Source: National Institute of Environmental Studies as of April 25, 2026.
The headline finding is stark: Kanto leads all districts with approximately 50,189 kt of residential emissions, followed by Kansai at 23,167 kt and Tokai at 15,653 kt, with these three districts alone accounting for over 60% of the national residential total — a concentration pattern consistent with prior years but now confirmed at higher resolution.FN2
Within Kanto, the dominant contributors are Yokohama and Kawasaki, which together generate some of the largest municipal residential emission volumes in Japan, followed by Chiba and Saitama cities; within the Tokyo metropolitan area itself, wards including Edogawa, Setagaya, Adachi, Itabashi, and Nerima stand out as the highest-emitting administrative units, reflecting their large residential populations and relatively lower rates of housing energy efficiency.FN3
High-Emission Residential Zones in the Kanto Region
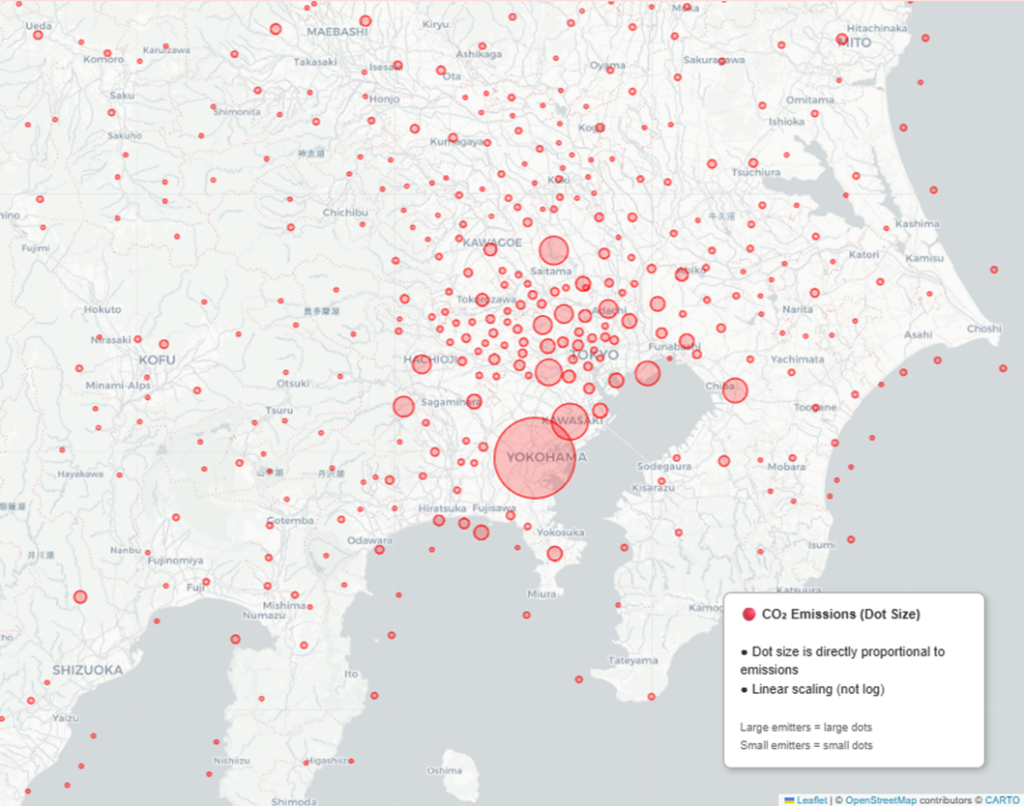
Source: Climate Trace as of April 25, 2026.
In the Kansai and Tokai blocks, the geographic concentration mirrors the urban hierarchy: Osaka, Kobe, and Kyoto anchor the Kansai district’s emissions profile, while Nagoya drives the Tokai figure — a pattern that underscores the near-perfect correlation between population density and residential carbon output across all ten districts.FN4
High-Emission Residential Zones in the Kansai and Tokai Regions
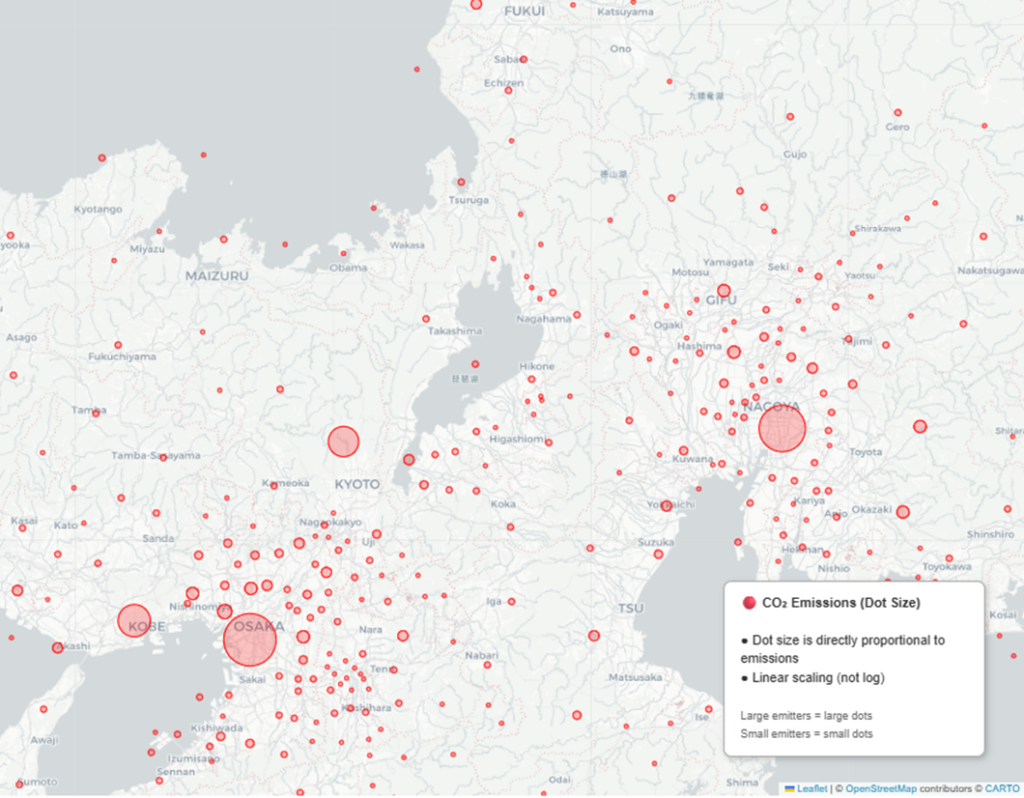
Source: Climate Trace as of April 25, 2026.
Further north, Hokkaido’s residential emissions are disproportionately concentrated in Sapporo, where heating demand amplified by the region’s severe winters produces some of the highest per-household emission intensities in the country; in Tohoku, Sendai performs a similar anchoring role.FN5
High-Emission Residential Zones in the Hokkaido and Tohoku Regions
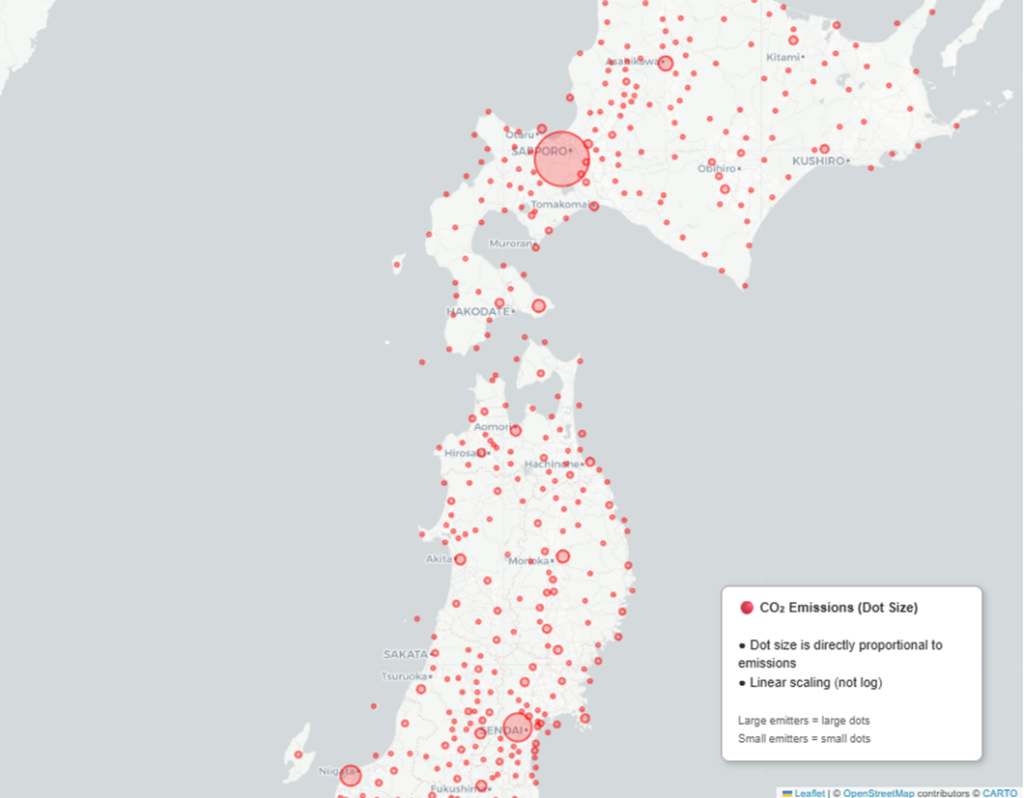
Source: Climate Trace as of April 25, 2026.
In Kyushu and the Chugoku region, the principal emitting cities are Kitakyushu, Fukuoka, Kumamoto, Kagoshima, Nagasaki, Miyazaki, and Hiroshima — a broader spread of mid-sized cities than in the Pacific coast megacorridors, but still a pattern where a handful of urban centres account for the decisive share of each district’s total.FN6
High-Emission Residential Zones in the Kyushu and Chugoku Regions
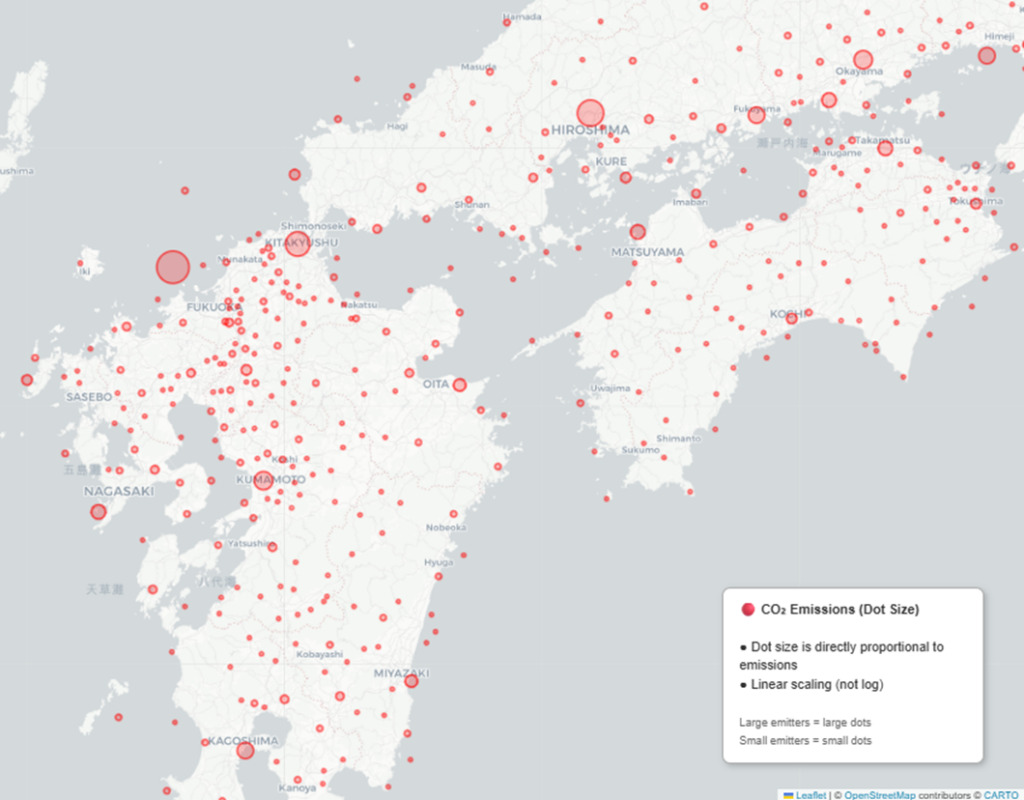
Source: Climate Trace as of April 25, 2026.
One less-discussed dimension that the 2024 data reinforces is the role of building vintage: the districts with the highest absolute emissions — Kanto in particular — also contain large stocks of pre-1980 housing built before the first energy efficiency standards were enacted, meaning that the emission concentration problem is simultaneously a retrofitting problem of considerable scale.FN7
Conclusion
The 2024 NIES inventory confirms that decarbonising Japan’s residential sector is, in practical terms, a problem of a limited number of large cities and their dominant building stocks.FN8 The policy and investment implication is direct: interventions targeting the top-emitting municipalities — Yokohama, Kawasaki, Osaka, Nagoya, Sapporo, and the high-emission wards of Tokyo — through accelerated grid decarbonisation, heat-pump subsidy programmes, and mandatory efficiency retrofits for older housing would capture a disproportionate share of the available national abatement potential.FN9 With Japan’s 2030 residential target requiring reductions at a pace well above recent trends, the city-level concentration of emissions identified here represents both the clearest statement of the challenge and the most actionable map for addressing it.FN10
Japanese translations
日本の住宅部門排出はどこから生じているのか:都市レベルで見る実態
2024年の最終確定版インベントリは、地図がすでに示していた事実を裏付けている —— 日本の家庭部門のカーボンフットプリントは、圧倒的に大都市圏に集中している。
2026年4月、国立環境研究所(NIES)は2024年度の温室効果ガス排出量インベントリ(確定値)を公表し、日本の住宅部門CO₂がどこで発生しているのかを、これまでで最も詳細な行政区画レベルで明らかにした。FN1
最も重要な結論は明確だ。住宅部門排出量は、関東が約50,189ktで全国最多、次いで関西が23,167kt、東海が15,653ktとなり、この3地域だけで全国住宅排出量の60%超を占める。これは過去の傾向と一致しているが、今回はより高解像度のデータでその集中度が確認された。FN2
関東の内部では、横浜市と川崎市が突出した排出量を示し、次いで千葉市、さいたま市が続く。東京都区部では、江戸川区、世田谷区、足立区、板橋区、練馬区などが特に高排出であり、人口規模の大きさと住宅のエネルギー効率の相対的な低さが背景にある。FN3
関西・東海でも、排出の地理的集中は都市階層構造をそのまま反映している。関西では大阪・神戸・京都が排出量の中心を形成し、東海では名古屋が圧倒的な寄与を示す。これは、全10地域に共通する「人口密度と住宅部門排出量のほぼ完全な相関」を裏付けるものだ。FN4
北日本では、北海道の住宅排出は札幌市に極端に集中している。厳冬期の暖房需要が大きく、1世帯あたり排出強度が国内でも最も高い水準にあるためだ。東北では仙台市が同様の役割を果たしている。FN5
九州・中国地域では、北九州、福岡、熊本、鹿児島、長崎、宮崎、広島といった中規模都市が主要な排出源となる。太平洋ベルト地帯ほどの巨大都市集中ではないものの、各地域の排出量の大半を少数の都市が占める構造は同じだ。FN6
2024年データが示す、あまり議論されてこなかった重要な論点として「建物の築年数」がある。絶対量が最も大きい関東をはじめ、排出量の高い地域には1980年以前に建てられた住宅ストックが大量に存在する。これは、排出集中の問題が同時に「大規模な省エネ改修の問題」でもあることを意味する。FN7
2024年のNIESインベントリは、日本の住宅部門の脱炭素化が実質的には「少数の大都市とその住宅ストック」に集中的に取り組むべき課題であることを明確に示している。FN8
政策・投資の含意は直接的だ。横浜、川崎、大阪、名古屋、札幌、そして東京都内の高排出区に対して、電力グリッドの脱炭素化の加速、ヒートポンプ導入補助の拡充、旧耐基準住宅の義務的な省エネ改修といった施策を重点的に実施することで、全国の削減ポテンシャルの大部分を効率的に確保できる。FN9
— ◆ —
References
FN1 — National Institute for Environmental Studies (NIES). Greenhouse Gas Emissions Data of Japan, Final Report FY2024. Released April 2026. Available at nies.go.jp.
FN2 — District-level residential emissions breakdown: Kanto 50,189 kt; Kansai 23,167 kt; Tokai 15,653 kt; Kyushu 12,819 kt; Tohoku 11,759 kt; Hokkaido 9,069 kt; Chugoku 7,919 kt; Hokuriku 6,671 kt; Shikoku 4,153 kt; Okinawa 1,269 kt. Source: NIES 2024 inventory.
FN3 — Municipal-level figures derived from Climate TRACE sub-national residential emissions data cross-referenced with NIES district totals. Ward-level Tokyo data sourced from Tokyo Metropolitan Government environmental reporting.
FN4 — Pearson correlation between district-level residential emissions and district population (2024 census basis) exceeds 0.95, confirming population density as the primary structural driver.
FN5 — Hokkaido regional heating intensity: average residential energy consumption per household in Sapporo estimated at approximately 1.5–1.8x the national average, reflecting climatic heating load. Source: Agency for Natural Resources and Energy, residential energy survey.
FN6 — Chugoku and Kyushu district totals distributed across a larger number of mid-sized cities relative to Kanto; Hiroshima, Fukuoka, and Kitakyushu each represent significant sub-regional emission centres.
FN7 — Ministry of Land, Infrastructure, Transport and Tourism (MLIT). Housing and Land Survey 2023. Approximately 40% of Japan’s housing stock predates 1980 energy efficiency standards; share is higher in Kanto and Tohoku.
FN8 — NIES. Op. cit. FN1. Sub-national concentration analysis indicates that the top 20 emitting municipalities likely account for approximately 40–50% of total national residential CO₂.
FN9 — IEA. Japan 2024 Energy Policy Review. Identifies building envelope retrofitting and electrification of heating as the two highest-impact residential decarbonisation levers in the Japanese context.
FN10 — Government of Japan. Nationally Determined Contribution (NDC), revised 2025. Residential sector target: approximately 50% reduction from FY2013 baseline by FY2030. As of April 2026, approximately 44 months remain.