

Photo by Carl Raw on Unsplash
Under Japan’s updated NDC, the commercial sector must cut emissions by 29% by 2030 and 65% by 2040 from 2024 levels — a transformative challenge concentrated in the country’s largest metropolitan regions.
A Sector Under Pressure
Japan’s commercial sector accounts for 17% of total national greenhouse gas emissions, and its decarbonisation pathway is among the most demanding in the economy. Under Japan’s Nationally Determined Contribution (NDC), the sector must achieve a 29% reduction in emissions by 2030 and a 65% reduction by 2040, both measured against 2024 levels.FN1 These are not incremental targets: they represent a fundamental restructuring of how commercial buildings, retail chains, service operators, and healthcare facilities consume energy across the country.FN2
“A 65% cut from 2024 levels by 2040 is not an efficiency target — it is a structural transformation of Japan’s entire commercial economy.”
The Top Emitters Within the Commercial Sector
A granular look at sub-sector data reveals significant variation in both scale and trajectory. The six largest contributors to commercial-sector emissions are: Wholesale and Retail Trade; Medical, Health Care and Welfare; Accommodations, Eating and Drinking Services; Education and Learning Support; Living Related and Personal Services and Amusement Services; and Miscellaneous Services, which includes Waste Disposal.FN1
Commercial Sector CO₂ Emissions by Sub-Sector, 1990–2024 (KtCO₂e)
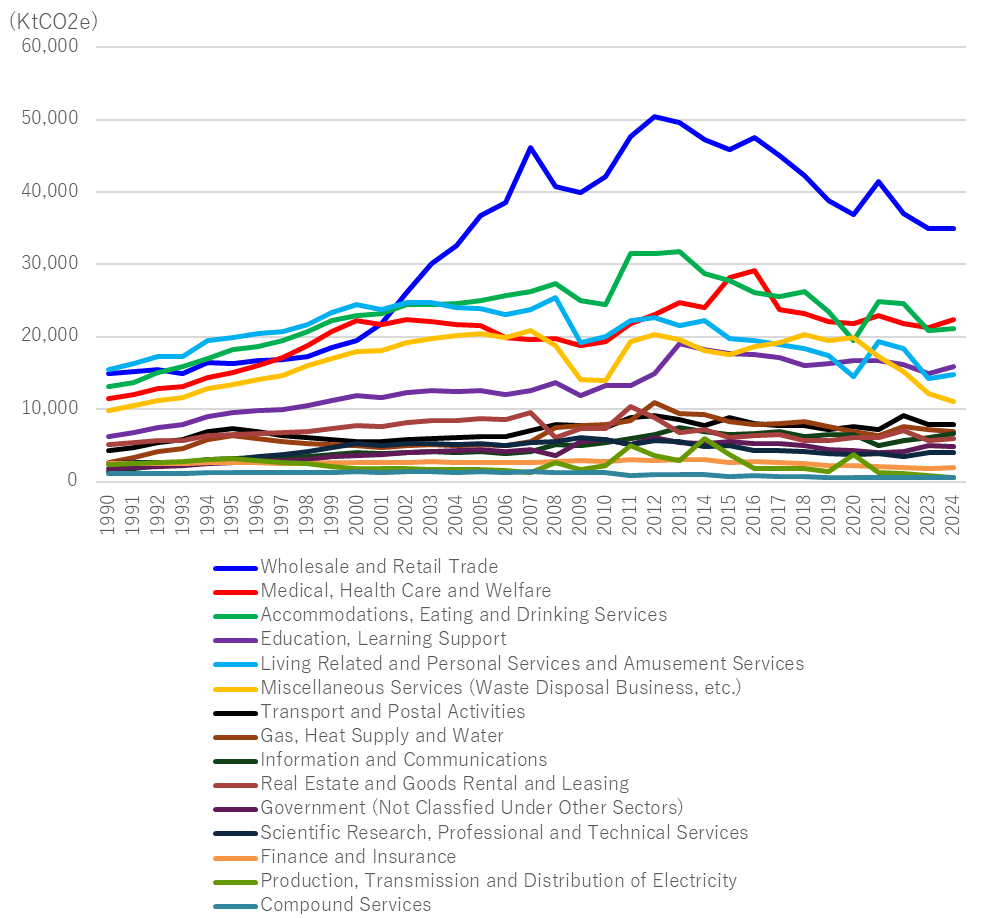
Notes: Sectors labeled ‘Unable to classify’ have been excluded from the chart above. Wholesale and Retail Trade is the dominant emitter, peaking near 50,000 KtCO₂e around 2012 before declining. Medical, Health Care and Welfare has shown recent growth against the broader downward trend. Source: NIES, S1:DR Analysis.
Since 2013, all six sub-sectors have broadly followed a declining emissions trend, consistent with Japan’s wider national trajectory.FN1 However, Medical, Health Care and Welfare stands out as an exception: its emissions have risen in recent years, possibly reflecting growing healthcare demand from Japan’s ageing population and the high energy intensity of hospital and care facility operations.FN2 This divergence underscores that the commercial sector is not monolithic — decarbonization strategies must account for sub-sectors where structural growth pressures resist straightforward reduction.
The Geography of Commercial Emissions
The spatial distribution of commercial emissions in Japan is strikingly concentrated. Urban metropolitan areas — Tokyo, Nagoya, Osaka, and Fukuoka — account for the overwhelming bulk of commercial-sector CO₂, a pattern that directly mirrors Japan’s highly urbanized economic structure.FN1
Geographic Distribution of Commercial Sector CO₂ Emissions Across Japan
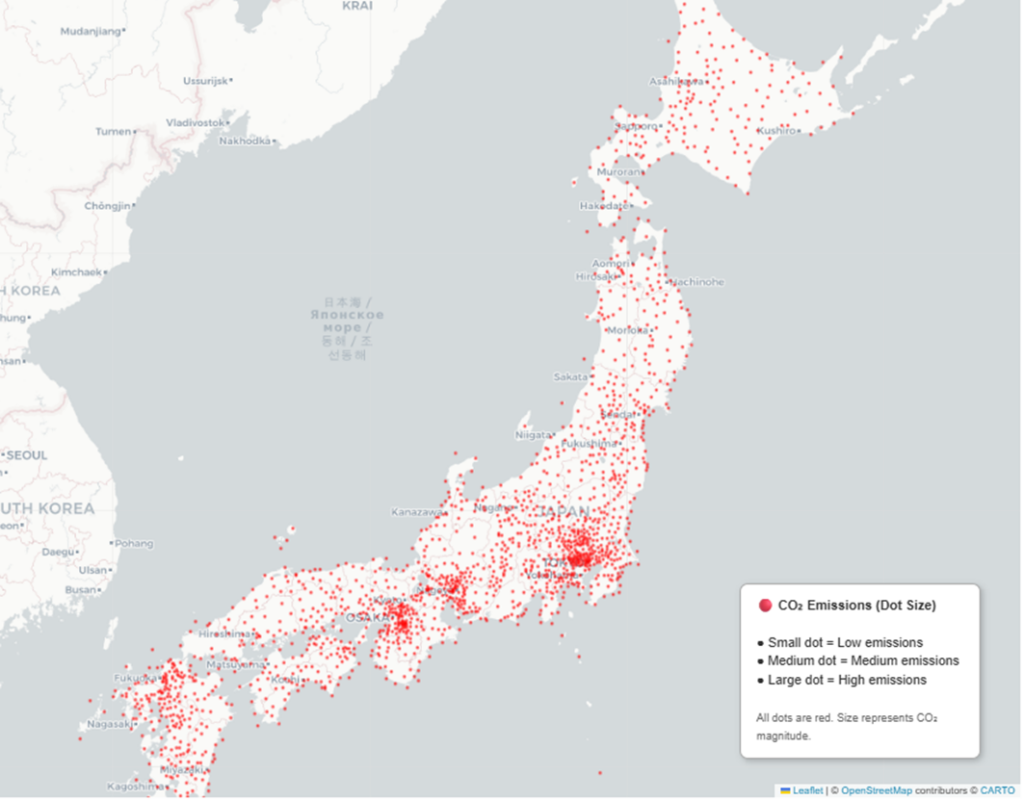
Notes: Red dots represent emission sources; dot size indicates magnitude. Dense clusters are visible along the Pacific coast from Tokyo through Nagoya to Osaka, and in northern Kyushu. Source: Climate Trace, S1:DR Analysis.
In the Greater Tokyo Area, emissions intensity is highest within the 23 Special Wards, but significant commercial CO₂ output extends outward into Saitama Prefecture, where retail parks, logistics hubs, and service clusters serving the capital have grown substantially.FN1 In Kansai and Chūbu, Osaka and Nagoya generate substantial emissions not only within city limits but across their broader surrounding municipalities, where commercial expansion has spread well beyond historic urban cores.FN2
Greater Tokyo Area
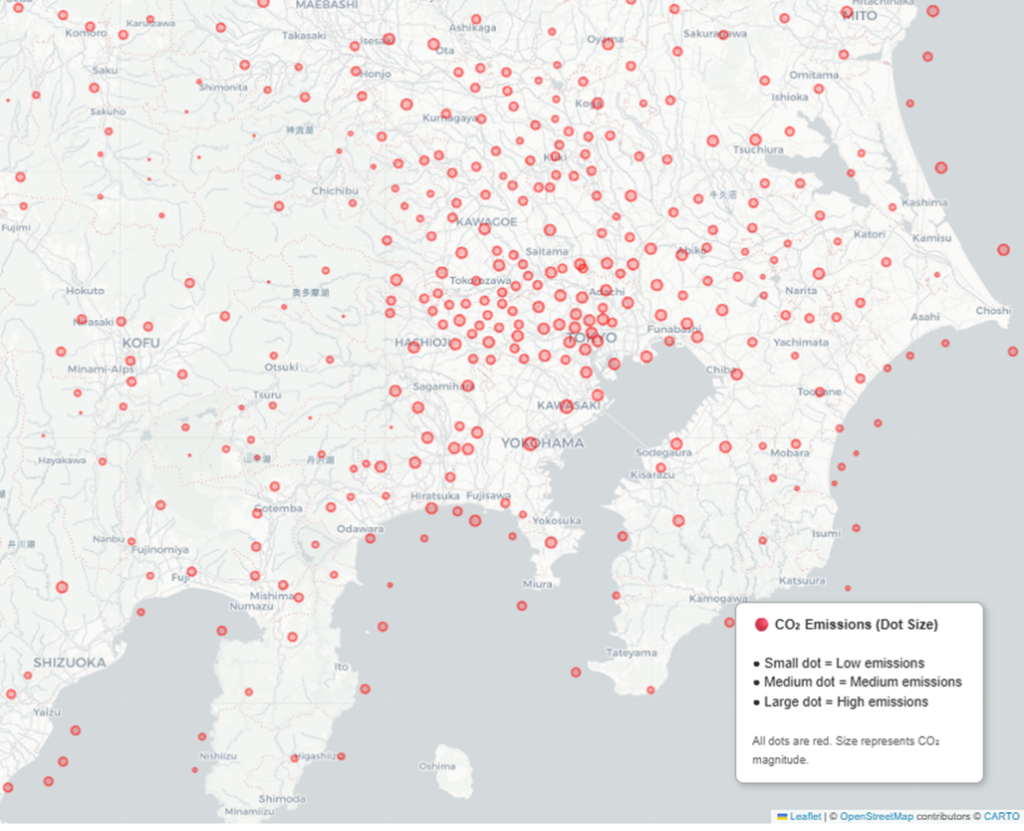
In the Tokyo region, high-density emissions are concentrated in the 23 Special Wards, with significant secondary clusters in Saitama and Kanagawa. Source: Climate Trace, S1:DR Analysis.
Kansai–Chūbu Region
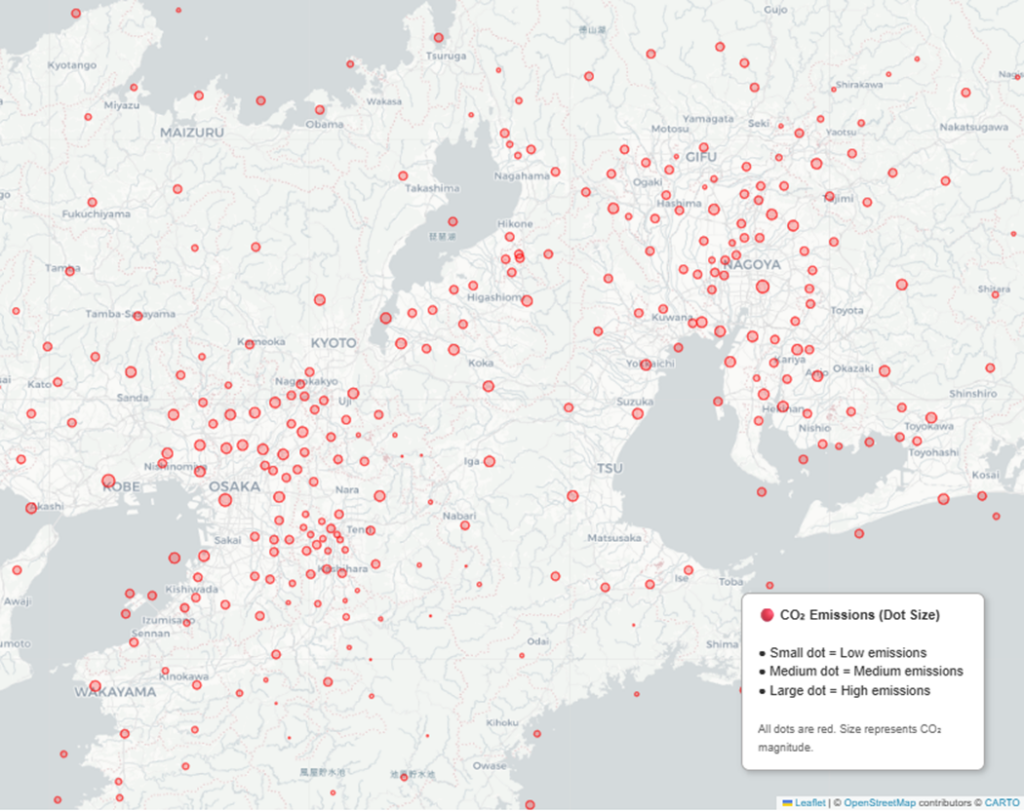
Dense emission clusters extend across the Osaka–Kyoto–Nagoya corridor. Source: Climate Trace, S1:DR Analysis.
Kyushu presents a distinct polycentric pattern. Fukuoka serves as the clear regional anchor for commercial emissions, but meaningful secondary concentrations exist in Nagasaki, Kumamoto, Kitakyushu, and Saga — all urban centres in their own right.FN1 This distributed structure will require coordinated regional policy rather than a single metropolitan-focused strategy.FN2
Kyushu Region: Commercial Sector CO₂ Distribution
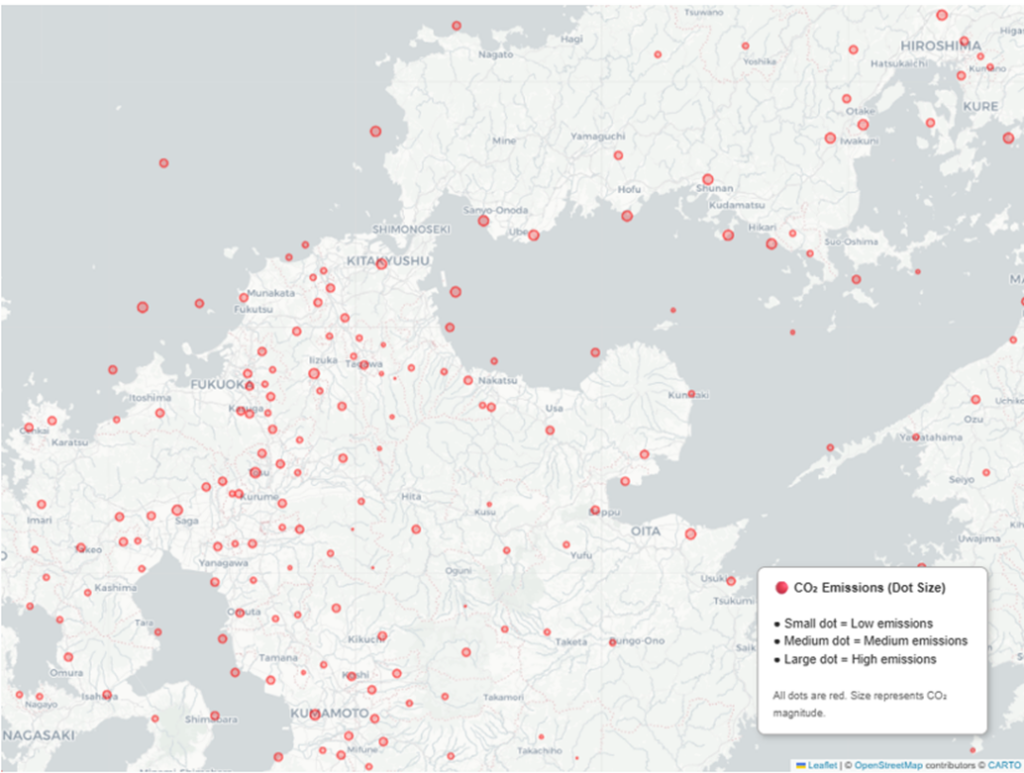
Fukuoka dominates as the regional core, with notable emission clusters in Kitakyushu, Nagasaki, Kumamoto, and Saga. Source: Climate Trace, S1:DR Analysis.
Conclusion
Japan’s commercial sector faces a pressing decarbonization deadline: 29% emissions reduction by 2030, 65% by 2040, with output concentrated in Tokyo, Osaka, Nagoya, and Fukuoka and driven by sub-sectors — from retail to healthcare — that vary sharply in their capacity to decarbonise.FN1 The declining trend since 2013 demonstrates that reduction is achievable, but the pace must accelerate substantially; policy frameworks must be geographically targeted, directing intervention toward urban commercial cores where the concentration of emissions makes action both most impactful and most urgent.
Japanese translations
日本の商業部門:脱炭素化の必然性
日本の最新NDC(国別削減目標)では、商業部門は2024年比で2030年までに29%、2040年までに65%の排出削減を達成しなければならない。これは、特に大都市圏に集中する構造的な変革を意味する。
プレッシャーにさらされる商業部門
日本の商業部門は、国内温室効果ガス排出量の17%を占めており、経済全体の中でも最も厳しい脱炭素化経路を課されている。NDCによれば、商業部門は2024年比で2030年に29%、2040年に65%の排出削減を達成する必要がある。FN1 これらは単なる効率改善ではなく、全国の商業ビル、小売チェーン、サービス事業者、医療施設がエネルギーを消費する仕組みそのものを再構築することを意味する。FN2
「2024年比で2040年に65%削減」という目標は、効率化ではなく、日本の商業経済全体の構造転換である。
商業部門の主要排出源
サブセクター別の詳細データを見ると、規模と排出動向には大きなばらつきがある。商業部門の排出量が最も多い6つのサブセクターは以下の通り:
- 卸売・小売業
- 医療・福祉
- 宿泊業・飲食サービス
- 教育・学習支援
- 生活関連サービス・娯楽サービス
注: “分類不能” とされたセクターは除外。卸売・小売業が最大の排出源で、2012年頃に約50,000 KtCO₂eでピーク。その後減少傾向。医療・福祉は近年増加傾向。
2013年以降、6つのサブセクターすべてが概ね減少傾向にあるが、医療・福祉だけは例外で、近年増加している。これは、高齢化による医療需要の増加や、病院・介護施設の高いエネルギー強度を反映している可能性がある。FN2 この乖離は、商業部門が一枚岩ではないことを示しており、脱炭素戦略は成長圧力が強いサブセクターに合わせて設計する必要がある。
日本の商業排出は地理的に極めて集中している。東京、名古屋、大阪、福岡といった大都市圏が商業部門CO₂の大半を占めており、日本の都市集中型経済構造をそのまま反映している。FN1
首都圏では、23区が最も排出強度が高いが、埼玉県にも大規模な排出クラスターが広がっている。これは、首都圏を支える大型商業施設、物流拠点、サービス集積が拡大してきたためである。FN1 関西・中部では、大阪と名古屋が市域だけでなく周辺自治体にも排出が広がっており、商業活動が歴史的中心部を超えて拡大している。FN2
九州は多中心型の構造を示す。福岡が明確な中心だが、長崎、熊本、北九州、佐賀にも顕著な排出クラスターが存在する。FN1 この分散構造は、単一都市に依存した政策ではなく、広域での協調的な脱炭素戦略を必要とする。FN2
結論
日本の商業部門は、2030年までに29%、2040年までに65%という厳しい削減目標に直面している。排出は東京・大阪・名古屋・福岡に集中し、サブセクターごとに脱炭素の難易度が大きく異なる。FN1 2013年以降の減少傾向は達成可能性を示すが、削減ペースは大幅に加速する必要がある。政策は地理的に焦点を絞り、特に都市部の商業集積に対して集中的に介入することで、最も大きな効果を発揮できる。
References
FN1 National Institute for Environmental Studies (NIES), Japan’s Greenhouse Gas Emissions Data (2013–2024), Official Statistical Release, 2026. Includes sectoral and sub-sectoral breakdown; geographic emissions distribution derived from facility-level reporting data.
FN2 Government of Japan, Japan’s Nationally Determined Contribution (NDC) — Updated Targets, including 2030 and 2040 Sectoral Pathways, Submission to UNFCCC / GX Basic Policy, 2022–2024. Specifies commercial sector reduction targets of 29% by FY2030 and 65% by FY2040 relative to 2024 levels, within the national net-zero by 2050 framework. See also: S1:DR, “Japan’s GHG Reduction Trajectory: Progress Made, Steep Climb Ahead”, April 2026.