

Photo by Chris LeBoutillier on Unsplash
Climate TRACE country inventory data reveals a decade-long split — rising emitters in the Global South versus declining ones in developed economies — even as the global total ticks upward.
Climate TRACE’s country-level inventory data for 2015–2025 reveals a stark and widening divergence in emissions trajectories across major economies.[FN1]
Diverging Emissions Paths Since 2015
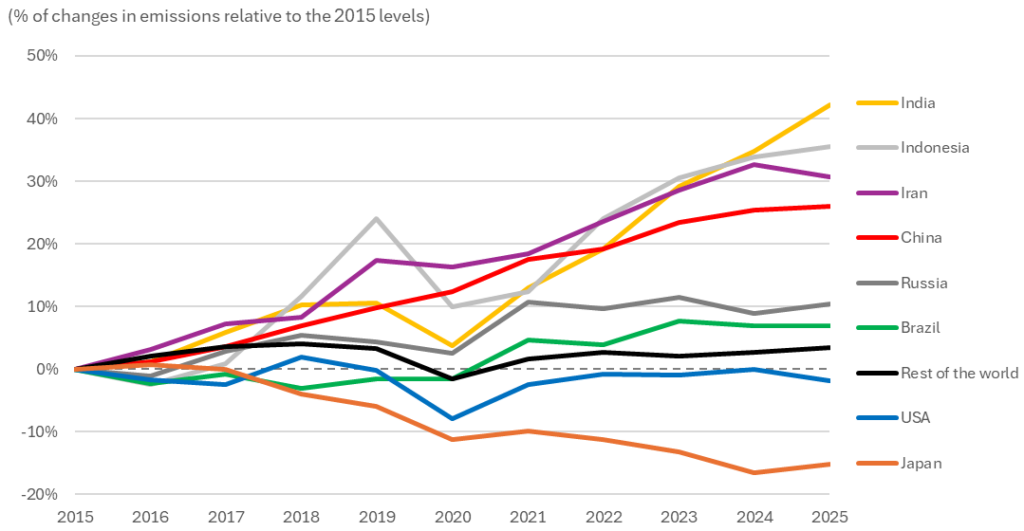
Data as of April 13, 2026. Source: Climate Trace
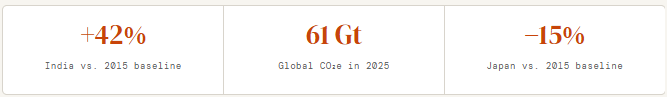
India leads all tracked nations with a 42% surge above its 2015 baseline by 2025, followed by Indonesia (+36%) and Iran (+31%), reflecting rapid industrial expansion and energy demand growth across the Global South.[FN2] China’s emissions climbed 26% over the decade, though Climate TRACE data show the rate of annual increase has slowed markedly in recent years — its power sector actually recorded its first-ever year-on-year decline in 2025.[FN3] Russia and Brazil posted modest but persistent growth (+10% and +7% respectively), while the “Rest of the World” aggregate held nearly flat (+3%), suggesting that emissions momentum is concentrated in a handful of high-growth economies.[FN4] At the other end of the spectrum, the United States has edged 2% below its 2015 level, and Japan stands out as the steepest decliner at −15%, a trend consistent with aggressive energy efficiency policy, nuclear restarts, and structural industrial contraction.[FN5]
Against this backdrop, the global aggregate tells a more sobering story: total greenhouse gas emissions rose from 55 GtCO₂e in 2015 to 61 GtCO₂e in 2025 — a 10.9% increase that erases the progress made by declining nations and underscores how growth in the developing world is currently outpacing decarbonization efforts elsewhere.[FN6]
Global Emissions (2015–2025)
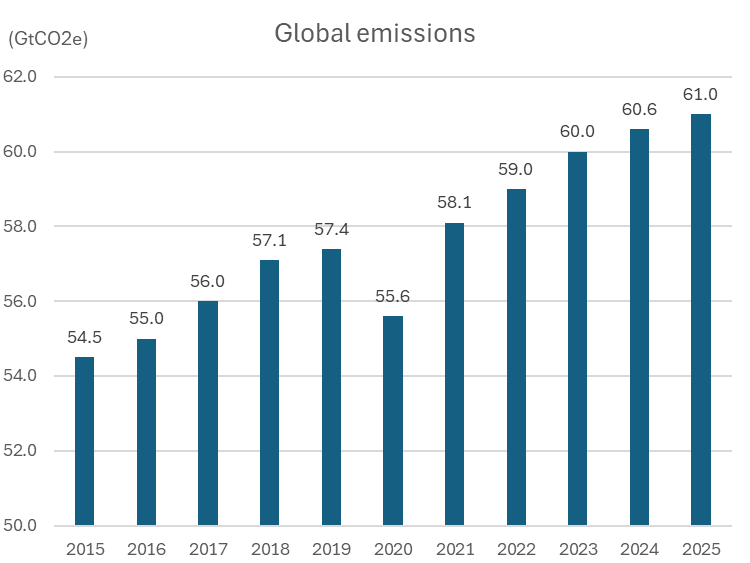
Data as of April 13, 2026. Source: Climate Trace
Insights
The data make clear that the global climate challenge cannot be addressed through action by developed economies alone.[FN1] Emissions reductions in Japan, the US, and parts of Europe are real but insufficient to offset accelerating growth from India, Indonesia, and Iran — nations that account for an ever-larger share of the global total. Without scalable financing mechanisms, technology transfer, and differentiated multilateral commitments that reflect countries’ varying stages of development, the 61 GtCO₂e ceiling reached in 2025 is likely not a peak but a waypoint on a still-rising trajectory.[FN6]
Japanese translations
世界の排出量の分岐点:2015〜2025
Climate TRACEの2015〜2025年における国別排出量インベントリデータは、主要経済国間において排出軌跡が際立って乖離しつつあることを示している。[FN1] インドは2025年時点で2015年ベースラインから42%増と全追跡国の中で最大の増加を記録し、インドネシア(+36%)、イラン(+31%)がこれに続き、グローバルサウスにおける急速な産業拡大とエネルギー需要の高まりを反映している。[FN2] 中国の排出量は10年間で26%増加したが、Climate TRACEのデータによれば年間増加率は近年著しく鈍化しており、電力部門においては2025年に史上初の前年比減少が記録された。[FN3] ロシアとブラジルは緩やかながら継続的な増加(それぞれ+10%、+7%)を示し、「その他の世界」の集計はほぼ横ばい(+3%)にとどまっており、排出量の勢いが一部の高成長経済に集中していることが示唆される。[FN4] 一方、スペクトルの反対側では、米国が2015年水準を2%下回り、日本は−15%と最大の減少幅を示しており、エネルギー効率化政策の推進、原子力の再稼働、産業構造の収縮といった要因が背景にある。[FN5] こうした状況の中、地球全体の数値はより厳しい現実を示している。温室効果ガスの総排出量は2015年の55 GtCO₂eから2025年には61 GtCO₂eへと10.9%増加しており、排出削減を進める先進国の取り組みが帳消しにされ、途上国の成長が他地域の脱炭素努力を上回っていることが浮き彫りになっている。[FN6]
結論
データが明確に示しているのは、地球規模の気候課題は先進国単独の行動では解決できないということだ。[FN1] 日本、米国、欧州の一部における排出削減は現実のものだが、インド、インドネシア、イランからの急増を相殺するには不十分であり、これらの国々は地球全体に占める割合をますます拡大させている。 各国の発展段階の違いを反映した、拡張可能な資金メカニズム、技術移転、そして差異化された多国間コミットメントなしには、2025年に達した61 GtCO₂eという水準は排出量のピークではなく、依然として上昇する軌跡上の通過点に過ぎない可能性が高い。[FN6]
References
FN1 Climate TRACE Coalition. Country Inventory — Climate TRACE. Country-level GHG emissions by sector, 2015–2025. Accessed April 2026.
FN2 Climate TRACE Coalition. Data Downloads. Annual country-level emissions by subsector and gas, 2015–2024, with projected 2025 figures. Released 2025–2026 (v5.5.0).
FN3 Climate TRACE Coalition. “Climate TRACE Data Show Global Greenhouse Gas Emissions Hit a New Record High in 2025.” Press release, February 26, 2026. China’s power sector emissions declined 0.39% in 2025 — the first such decline since the inventory began in 2015.
FN4 Climate TRACE Coalition. Data Downloads. Emissions aggregated by country grouping, 2015–2025. Global rate of emissions growth slowed from an average of 1.1%/year (2015–2023) to 0.5%/year over the past two years.
FN5 Climate TRACE Coalition. Country Inventory — Japan. Japan country-level inventory, 2015–2025. Accessed April 2026. Japan’s −15% vs. 2015 baseline is consistent with national energy efficiency and industrial structure trends.
FN6 Climate TRACE Coalition. “Climate TRACE Data Show Global Greenhouse Gas Emissions Hit a New Record High in 2025.” February 26, 2026. Global emissions reached approximately 61 GtCO₂e in 2025 — a record high since inventory tracking began in 2015.
Published on S1DR.com — Climate Intelligence Data: Climate TRACE (CC BY 4.0)